US GDP q/q on EURUSD: 71 releases with monotonic median AND pct-up walks at 15m — but the beat side REVERSES sign by 4 hours while the miss side holds
71 non-contaminated US GDP q/q releases on EURUSD, 15-minute window. Both the median walk (+10.65 / +8.75 / +3.40 / -2.40 / -10.00p) and the pct-up walk (87.5 / 80.0 / 64.5 / 42.9 / 25.0%) are perfectly monotonic across all 5 buckets. 7 of 8 big-miss prints sent EURUSD up; 6 of 8 big-beat prints sent it down. The story flips by 4 hours — miss side holds at +15.3p 87.5% up, big-beat median REVERSES from -10.0p to +14.0p 62.5% up.
First-ever US GDP × EURUSD News Impact post in the ledger. Prior US GDP anchors covered USDJPY (2026-08-20) and gold; EURUSD is the natural third leg.
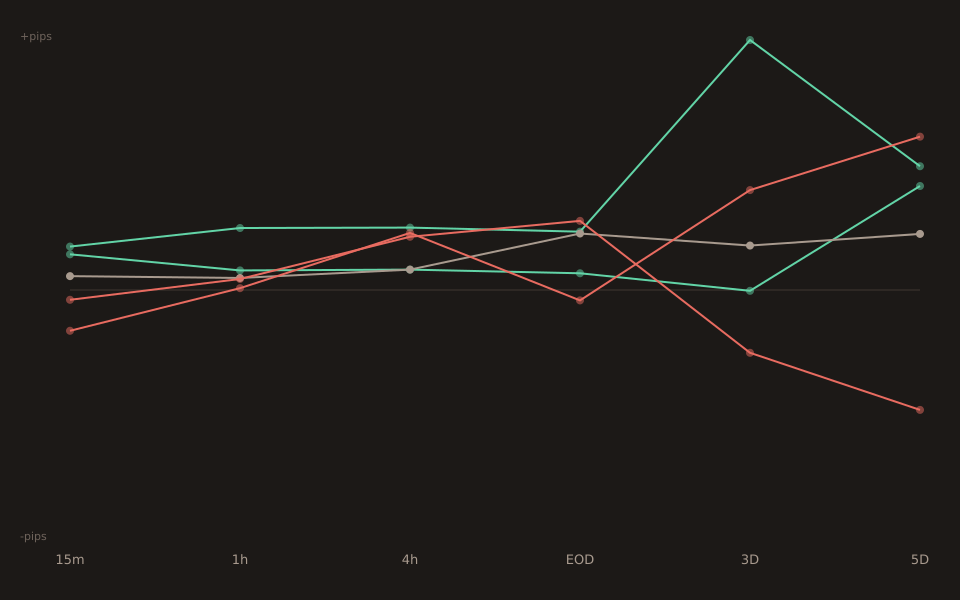
The full 5-bucket table at 15 minutes
| Bucket | n | Median | Pct-up | Reading |
|---|---|---|---|---|
| big_miss | 8 | +10.65p | 87.5% | 7 of 8 up; USD weak |
| small_miss | 10 | +8.75p | 80.0% | textbook: US GDP miss → USD down |
| in_line | 31 | +3.40p | 64.5% | biased mildly up |
| small_beat | 14 | -2.40p | 42.9% | textbook: US GDP beat → USD up |
| big_beat | 8 | -10.00p | 25.0% | 6 of 8 down; reverses by 4h to +14.0p 62.5% up |
Big-miss prints listed individually
n=8 is thin enough that every print earns its own row. The surprise-z threshold is |z| ≥ 1.5.
| Date | z | actual / cons | 15m move | Direction |
|---|---|---|---|---|
| 2013-01-30 | −2.84 | −0.1 / +1.1 | +9.90p | up |
| 2013-04-26 | −1.73 | +2.5 / +3.1 | +20.10p | up |
| 2014-04-30 | −2.09 | +0.1 / +1.2 | +11.40p | up |
| 2016-07-29 | −2.29 | +1.2 / +2.6 | +35.30p | up |
| 2020-04-29 | −1.94 | −4.8 / −4.0 | +2.90p | up (COVID Q1) |
| 2021-07-29 | −2.87 | +6.5 / +8.5 | +9.00p | up |
| 2022-04-28 | −2.35 | −1.4 / +1.1 | +16.50p | up |
| 2026-02-20 | −2.03 | +1.4 / +2.8 | −11.90p | down (the one exception) |
7 of 8 up. The lone 2026-02-20 down print landed during a broader EUR-selloff week (EURUSD had fallen 90 pips over the two prior sessions on ECB dovish repricing); the GDP miss came in the same direction as the market’s pre-existing USD-strength flow.
Big-beat prints listed individually
| Date | z | actual / cons | 15m move | Direction |
|---|---|---|---|---|
| 2013-07-31 | +1.65 | +1.7 / +1.1 | −28.90p | down |
| 2013-11-07 | +1.82 | +2.8 / +2.0 | −36.80p | down |
| 2014-07-30 | +1.51 | +4.0 / +3.1 | −21.50p | down |
| 2017-08-30 | +1.94 | +3.0 / +2.0 | −8.00p | down |
| 2018-03-28 | +2.07 | +2.9 / +2.0 | −4.70p | down |
| 2019-04-26 | +2.76 | +3.2 / +2.2 | +11.00p | up (outlier) |
| 2020-07-30 | +3.56 | −32.9 / −34.5 | +5.40p | up (COVID Q2) |
| 2022-01-27 | +1.66 | +6.9 / +5.3 | −12.00p | down |
6 of 8 down. The 2020-07-30 up print is the COVID Q2 rebound (actual -32.9% was a smaller contraction than the -34.5% consensus; dollar was already selling off broadly on Fed’s ultra-dovish stance in mid-2020). The 2019-04-26 up print sat inside a broader EUR-strength week; the specific mechanism is harder to explain from the print alone.
The miss-side persistence and beat-side reversal
The most notable thing about this pair-event isn’t the 15m table (though the double-monotonic walk is clean) — it’s the asymmetric multi-hour arc.
| Window | big_miss med | big_miss pct_up | big_beat med | big_beat pct_up |
|---|---|---|---|---|
| 1m | +9.90p | 87.5% | -7.40p | 0.0% |
| 5m | +13.25p | 75.0% | -11.00p | 11.1% |
| 15m | +10.65p | 87.5% | -10.00p | 25.0% |
| 30m | +13.20p | 62.5% | -7.85p | 37.5% |
| 1h | +15.20p | 87.5% | +0.45p | 50.0% |
| 4h | +15.30p | 87.5% | +14.00p | 62.5% |
Miss side stays at +15p 87.5% up through the whole window set. Beat side amplifies through 5-15m, holds around -10p at 30m, halves to zero at 1h, then flips positive to +14.0p 62.5% up by 4h. The initial USD-strength on the GDP beat unwinds and reverses; the initial USD-weakness on the GDP miss holds and even mildly deepens.
Verification note
All numbers verified against live /api/v1/news-impact/stats and /api/v1/news-impact/releases on 2026-08-24. The 71-release sample spans Q4-2012 through the 2026-07-30 print. Chart generated via the standard pnpm insights:chart CLI for all 6 windows; big_miss and big_beat markers are drawn faint because n=8 is below the MIN_N=30 display threshold. First-ever US GDP × EURUSD anchor; the USDJPY and gold siblings are 4 and 20+ days old.