AUDNZD is the only major pair whose loudest hour of the week isn't in the London/NY overlap
Across all 28 pairs in the Calm Zones catalogue, 27 of them have their loudest half-hour cell in the London/NY overlap on a Thursday or Friday. AUDNZD is the exception. Its loudest cell is Wednesday 21:00 UTC — the Sydney/Wellington market open — with a median 30-minute range of 12.6 pips across 847 days of coverage.
This is a weird thing about AUDNZD, and it’s a good hook for why the pair trades differently than the rest of the majors and crosses.
The one pair that breaks the rule
Iterate every pair through /api/v1/calm-zones/scan, take the cell with the largest median_range_pips, and record the session it falls in. The result is monotonous for 27 pairs and interesting for the 28th:
| Pair | Loudest cell (UTC) | Session | Median (pips) |
|---|---|---|---|
| AUDNZD | Wed 21:00 | Asia* | 12.6 |
| GBPNZD | Fri 14:30 | Overlap | 34.5 |
| GBPAUD / GBPCAD | Fri 14:30 | Overlap | 30.2 |
| GBPJPY | Fri 13:30 | Overlap | 28.3 |
| EURNZD | Fri 14:30 | Overlap | 27.6 |
| EURCAD | Fri 13:30 | Overlap | 24.5 |
| EURAUD | Fri 14:30 | Overlap | 23.8 |
| EURJPY / GBPUSD | Thu 13:30 | Overlap | 22.2-22.5 |
| USDCAD, GBPCHF, CHFJPY, CADJPY, EURUSD, USDJPY, AUDJPY, USDCHF, AUDUSD, NZDJPY, AUDCAD, NZDCAD, CADCHF, AUDCHF, NZDUSD, NZDCHF, EURGBP, EURCHF | Thu or Fri 13:30-14:30 | Overlap | 10.9-19.8 |
Every USD-facing pair — from the most-traded (EURUSD) to the least (NZDCHF) — peaks in the London/NY overlap between 13:30 and 14:30 UTCon Thursday or Friday. That’s when the US data cluster hits (jobless claims, GDP releases, NFP, retail sales) and when the two most liquid FX sessions overlap. Every G10 cross without USD in it does the same thing, because the “risk-on / risk-off” flow that dominates those crosses is driven by the same US-data prints.
AUDNZD is the pair where both legs are of similar liquidity, both legs share the same commodity exposure, and both legs share the same broad Pacific-Asia macro backdrop. The pair captures the residual differencebetween AUD and NZD. That residual doesn’t care about US data as much — it cares about Australia-vs-New Zealand divergence, which shows up during Sydney/Wellington hours.
AUDNZD’s Wednesday, hour by hour
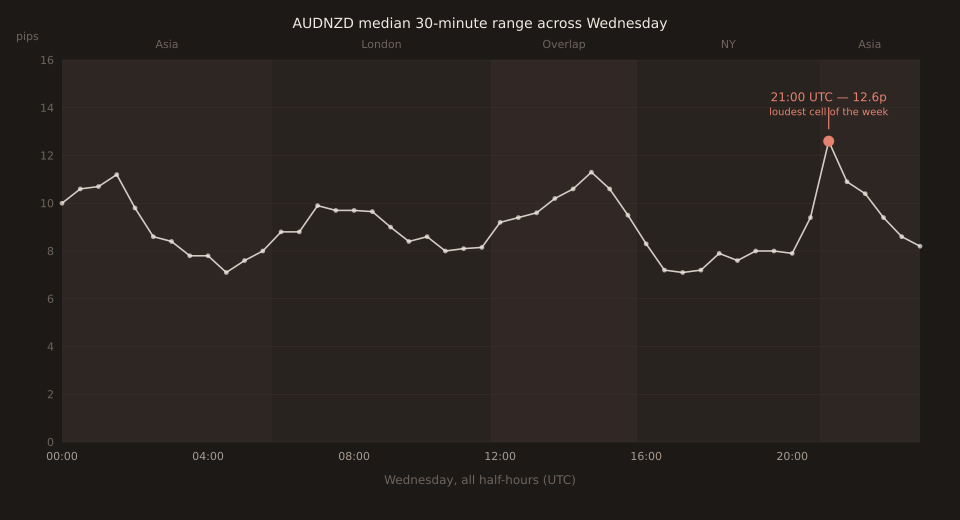
The chart makes the shape clear. AUDNZD has two daily peaks, not one: an overlap-band bump at 14:00-15:00 UTC (around 11 pips) and the taller Wellington-open spike at 21:00 UTC (12.6 pips). The Wellington-open peak is ~15% louder than the overlap peak on this specific weekday. And unlike most pairs, where the Asian session is the quietest window of the day, on AUDNZD the Sydney/Wellington morning cluster is where the pair actually moves.
Why the pair anchors to Wellington instead
Three mechanical reasons.
First: no USD leg. The dominant force in most majors is the dollar, which trades most heavily during US hours. Take USD out (as in EURGBP or AUDNZD) and the pair loses its biggest volatility driver. What remains is the divergence between the two non-USD legs — which comes from whatever moves one currency without moving the other.
Second: both legs get their scheduled domestic data in Asian hours.The RBA meets in Sydney at 04:30 UTC-ish (dep. DST), Australia’s CPI, employment, and retail sales release between 00:30 and 01:30 UTC. New Zealand’s CPI, employment, GDP, and RBNZ decisions release between 21:45 and 02:00 UTC. That entire cluster of scheduled AUD- and NZD-specific prints falls in the Sydney/Wellington open window — not in the London/NY overlap.
Third: the residual is exactly the trade.AUDNZD strips out global risk-on/risk-off (both legs move roughly together against USD, JPY, and CHF on those flows) and leaves the Australia-vs-New Zealand relative-value trade behind. Any divergence in the AU-vs-NZ macro cycle registers on AUDNZD but cancels out on AUDUSD and NZDUSD taken separately. That’s the trade the pair exists to express, and it’s reset every morning in Sydney and Wellington.
What this doesn’t say
Wednesday 21:00 UTC is DST-ambiguous. The cell carries session_purity 0.66and the ambiguous flag, because it lands in a slightly different local hour during Australia’s and New Zealand’s DST rotation. The tool marks the cell with a coral chip and dashed outline to flag this; the ~15% loudest-cell margin over the overlap peak is comfortably larger than the DST wobble, but the exact time-of-day interpretation is a bit soft.
“Loudest” is relative to AUDNZD, not to anything else. A 12.6 pip median half-hour range is quiet compared to GBPJPY’s 28.3 peak or GBPNZD’s 34.5. AUDNZD is a genuinely low-volatility pair; the point of this post is about the shape of its week, not the amplitude.
Sample doesn’t cover regime changes cleanly. The data spans 2010-01-01 through 2026-07-21. The 2015 SNB shock didn’t touch this pair; but the 2020 COVID vol regime, the 2022 RBA/RBNZ hiking cycle, and the 2024-2025 rate-cut cycle are all averaged into the same cell values. Any single week’s shape can differ; the base rate is what the tool reports.
Open the tool → Free forever. No signup. No email required.