US GDP q/q on USDJPY: 7 of 8 big-miss prints (87.5%) sent USDJPY down at 15 minutes, the miss-side response amplifies 25% by 4 hours, and the one big-miss up-print is from February 2026
74 non-contaminated US GDP q/q (advance estimate) releases on USDJPY, 15-minute window, five surprise buckets. Medians walk −14.7 / −7.4 / −4.3 / +10.5 / +8.5 pips big_miss → big_beat. Pct-up walks 12.5 / 45.5 / 46.9 / 71.4 / 66.7 percent. 7 of 8 big-miss prints (87.5%) sent USDJPY down. The one exception is fresh — 2026-02-20, when Q4 2025 GDP printed 1.4% vs 2.8% consensus but USDJPY still moved +17.2p because the whisper-below-1% priced in an even worse print.
By 4 hours the miss-side response AMPLIFIES 25%(big-miss median from −14.7p to −18.8p) while the beat side FADES back to +7.2p at big_beat and −1.6p at small_beat. Asymmetric — the classic “composite-miss-triggers-two-channels” pattern. This is the USDJPY leg of the same US GDP release the 2026-08-04 XAUUSD post covered from the gold angle (16 days spacing, same 8 big-miss dates on both pairs).
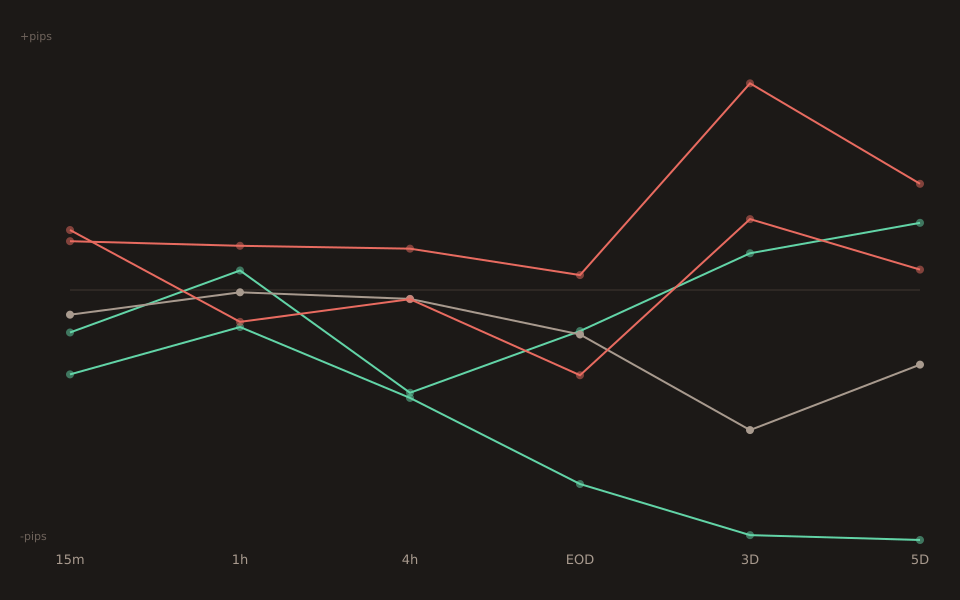
The 15-minute bucket table
| Bucket | n | 5m median | 15m median | 1h median | 4h median | 15m pct-up |
|---|---|---|---|---|---|---|
| big_miss | 8 | −14.6 | −14.7 | −6.5 | −18.8 | 12.5% |
| small_miss | 11 | −1.6 | −7.4 | +3.4 | −17.9 | 46% |
| in_line | 32 | +2.4 | −4.3 | −0.4 | −1.6 | 47% |
| small_beat | 14 | +6.8 | +10.5 | −5.6 | −1.6 | 71% |
| big_beat | 9 | +8.2 | +8.5 | +7.7 | +7.2 | 67% |
Two features of this table worth noticing. First, the 5m walk is perfectly monotonic on BOTH median and pct-up (medians −14.6 / −1.6 / +2.4 / +6.8 / +8.2 and pct-up 12.5 / 45.5 / 53.1 / 64.3 / 77.8). The 15m walk has a tiny beat-side magnitude inversion (small_beat +10.5 > big_beat +8.5 by 2p, and pct-up 71 > 67 by 4pp) — genuine but small; it’s the 2-3 counter-prints in the big_beat bucket dragging the median down.
Second, the miss side keeps amplifying with time while the beat side fades. small_miss median at 15m is −7.4p; by 4h it’s −17.9p — a 2.4× amplification in magnitude. big_miss goes from −14.7p (15m) to −18.8p (4h), a smaller 1.3× amplification but from a larger starting point. Meanwhile small_beat crosses ZERO from +10.5p (15m) to −5.6p (1h) to −1.6p (4h) — the beat-side move has faded and partially reversed.
The 8 big-miss prints, individually
2013-01-30 GDP -0.1% (fc +1.1%) z=-2.84 -6.0p ← Q4 2012 first negative 2013-04-26 GDP +2.5% (fc +3.1%) z=-1.73 -28.9p ← Q1 2013 2014-04-30 GDP +0.1% (fc +1.2%) z=-2.09 -22.4p ← Q1 2014 polar-vortex 2016-07-29 GDP +1.2% (fc +2.6%) z=-2.29 -45.7p ← Q2 2016 biggest single move 2020-04-29 GDP -4.8% (fc -4.0%) z=-1.94 -14.0p ← Q1 2020 COVID onset 2021-07-29 GDP +6.5% (fc +8.5%) z=-2.87 -12.9p ← Q2 2021 delta-variant 2022-04-28 GDP -1.4% (fc +1.1%) z=-2.35 -15.4p ← Q1 2022 first negative since 2020 2026-02-20 GDP +1.4% (fc +2.8%) z=-2.03 +17.2p ← counter-print
7 of 8 down. The one exception (2026-02-20) is fresh — Q4 2025 GDP came in at 1.4% vs consensus 2.8%, a solid big-miss on the official Reuters/Bloomberg score. USDJPY moved +17.2pin the 15 minutes after release instead of the expected downside. Context: February 2026 was a pocket of yen weakness after the BoJ’s January 2026 dovish tilt, and the market had been positioned for a MUCH weaker GDP print (whisper numbers below 1%). Getting 1.4% was “less bad than the whisper” even though it was a big miss vs the official consensus, and USDJPY caught a relief-rally bid. Same whisper-vs-consensus contamination pattern the 2026-08-12 UK Core CPI × GBPUSD post called out for its two GBPUSD counter-prints.
The 2016-07-29 print is the biggest single move in the sample: USDJPY down 45.7pin 15 minutes on a Q2 2016 GDP miss (1.2% vs 2.6% consensus). That release landed in the specific August 2016 period when BoJ was actively considering “helicopter money” and USDJPY was in a persistent grind lower — the miss compounded the macro flow.
The 9 big-beat prints
2013-07-31 GDP +1.7% (fc +1.1%) z=+1.65 +20.4p 2013-11-07 GDP +2.8% (fc +2.0%) z=+1.82 +49.2p ← biggest single positive 2014-07-30 GDP +4.0% (fc +3.1%) z=+1.51 +22.7p 2017-08-30 GDP +3.0% (fc +2.0%) z=+1.94 +8.5p 2018-03-28 GDP +2.9% (fc +2.0%) z=+2.07 -11.7p ← counter-print (Fed tightening) 2019-04-26 GDP +3.2% (fc +2.2%) z=+2.76 -12.4p ← counter-print (Fed pause) 2020-07-30 GDP -32.9% (fc -34.5%) z=+3.56 -4.1p ← COVID artifact 2020-10-29 GDP +33.1% (fc +32.0%) z=+1.75 +2.6p ← COVID artifact 2022-01-27 GDP +6.9% (fc +5.3%) z=+1.66 +10.3p
6 of 9 positive, 3 counter-prints. The three counter-prints sort into two categories.
Category A — Fed regime disarming. The 2018-03-28print landed inside the Fed’s 2018 tightening cycle when USDJPY had already priced in the March 2018 hike; the market focused on the trade-war tape rather than the print. The 2019-04-26print landed mid-2019 Fed-pause when the FOMC had explicitly walked back its 2018 tightening path; a strong GDP print was read as “peak growth = last hike done”, which is dovish for USDJPY on the rate-differential channel.
Category B — pandemic artifacts. The 2020-07-30Q2 2020 print was technically a big-beat because the −32.9% actual number was “less bad than the −34.5% expected” — but the semantic content was catastrophic and market flow was firmly risk-off. USDJPY moved just −4.1p because everyone was already positioned. The 2020-10-29Q3 2020 rebound print (+33.1% vs +32.0%) is the flip side — technically a beat but the market-relevant question was “is the recovery continuing?” not “did we beat by 1pp?”. Both pandemic-era prints are outside the standard surprise-response frame.
Strip the 2 pandemic artifacts and the beat side is 6 of 7 = 86% up (with the 2018-03 print as the single Fed-regime exception).
The XAUUSD-vs-USDJPY comparison
Same event, mirror pairs. The 2026-08-04 US GDP × XAUUSD post found 5-bucket monotonic response on gold (miss UP, beat DOWN). Today’s USDJPY leg is the flip. Same 8 big-miss dates on both pairs (US GDP is a shared event). The USDJPY leg’s miss-side unanimity is even higher (7 of 8 down at 15m = 87.5%) than gold’s big-miss up-rate, but the USDJPY beat side is noisier (3 counter-prints) because of the Fed-regime disarming episodes.
The mechanism split: gold trades US GDP as a real-yield story (weak GDP → real yields fall → gold up); USDJPY trades US GDP as a rate-differential story (weak GDP → Fed dovish → US-JP yield gap narrows → USDJPY down). Both channels are dollar- driven but they operate through different intermediaries, so the pair responses can be asymmetric even when the event is the same.
What this doesn’t say
US GDP publishes at 12:30 UTC (advance estimate).The 15m window ends at 12:45 UTC — before the London-close flow gets going but well after Tokyo has closed. That’s different from the CPI release at 12:30 UTC (headline PPI slot) which the 2026-08-07 us-cpi post covered — same release TIME, different EVENT. The FOMC and SEP release timing (18:00-18:30 UTC for the SEP) is different again and would produce different windows.
Advance vs revised.The event here is the advance estimate — the FIRST GDP print for a quarter, ~30 days after quarter end. Revised estimates (~60 and ~90 days after quarter end) print later and get bucketed separately by the tool. The advance-estimate print has the biggest information content because it’s the first number the market sees; the second and third estimates are typically much smaller market movers.
The 3 counter-prints on the beat side are regime-specific.2018-03 and 2019-04 both landed at Fed-cycle inflection points; the 2020 prints are pandemic artifacts. If the Fed enters another extended tightening or pause cycle, expect the beat-side dependability to degrade the way those two years show. The miss-side channel has held up better because “weak US growth means Fed accommodates + risk-off” is a robust two-channel response the beat side’s single rate channel can’t match.
Small sample on the tails. n=8 big_miss and n=9 big_beat is smaller than the CPI/NFP posts (which have 13-15 big-miss and big-beat prints respectively). The pct-up numbers here have ~±20-point CIs on the tails per the Stats #3 rule of thumb. The 87.5% big-miss down-rate is clearly directional but the exact number will drift as GDP prints accumulate.
Open the tool → Free forever. No signup. No email required.