Canada CPI m/m on CADJPY: 15 of 19 big-beat prints sent the pair up, and the 5-bucket median walk is monotonic — the JPY cross beats USDCAD once again
194 non-contaminated Canada CPI m/m releases on CADJPY, 15-minute window. Medians walk −11.1 / −4.8 / +1.1 / +10.4 / +18.7 pips big_miss → big_beat. Pct-up walks 15.4 / 35.4 / 55.6 / 63.6 / 78.9 percent. Both walks are monotonic across every one of the five surprise buckets — and the same event on USDCAD is not, because its miss-side medians invert.
Three days ago I ran the analogous analysis for Canada Unemployment on USDCAD — that one was fully monotonic across every window from 1 minute to 4 hours. CAD CPI m/m on USDCAD isn’t quite so clean: at 15m the miss-side medians are +12.8p (big_miss) vs +12.95p (small_miss), a small inversion. On CADJPY the same event walks cleanly big_miss −11.1p → small_miss −4.8p → in_line +1.1p → small_beat +10.4p → big_beat +18.7p. The direction is right on both pairs; the cleanness of the WALK is only clean on CADJPY.
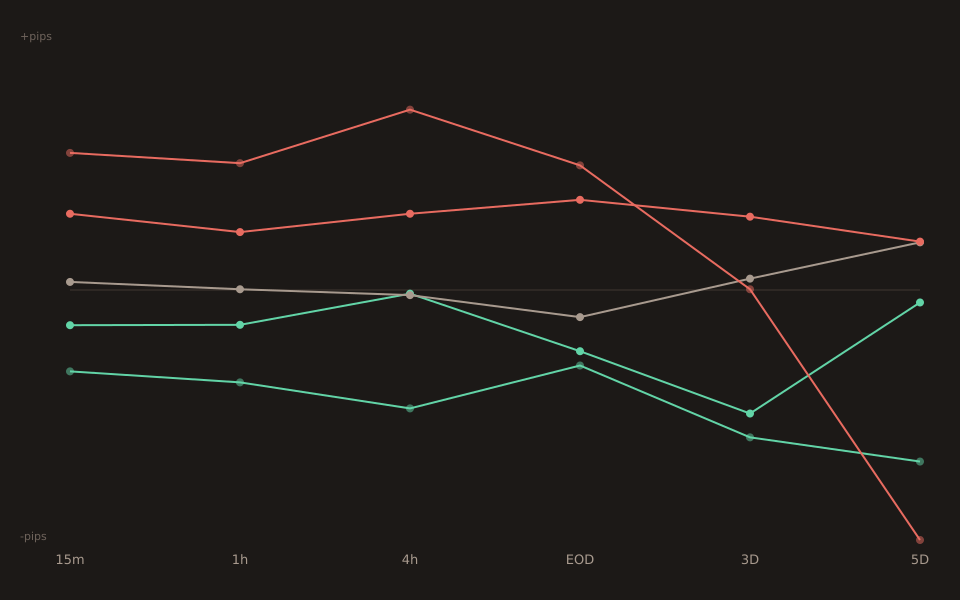
The 15-minute bucket table
| Bucket | n | 15m median | p25 | p75 | Pct up (15m) |
|---|---|---|---|---|---|
| big_miss | 13 | −11.10 | −26.90 | −3.90 | 15.4% |
| small_miss | 48 | −4.80 | −25.90 | +2.90 | 35.4% |
| in_line | 81 | +1.10 | −7.30 | +12.00 | 55.6% |
| small_beat | 33 | +10.40 | −9.00 | +24.60 | 63.6% |
| big_beat | 19 | +18.70 | +2.70 | +46.30 | 78.9% |
Every column walks the right direction. The p25 column is also monotonic on the beat side (−9.0 → +2.7) and roughly monotonic on the miss side (−26.9 → −25.9 → −7.3), which tells you the small-miss cluster is not being carried by outliers — the typical outcome is a small down move, not a flat print with a couple of big ones pulling the median.
The 19 big-beat prints, individually
Nineteen observations is small enough to list. Fifteen are positive CADJPY moves at 15 minutes; four are negative:
2010-08-20 actual=+0.50 cons=+0.00 z=+3.08 −4.00p ← miss 2011-04-19 actual=+1.10 cons=+0.70 z=+1.96 +51.00p 2011-06-29 actual=+0.70 cons=+0.20 z=+2.16 +23.00p 2013-03-27 actual=+1.20 cons=+0.60 z=+4.16 +23.80p 2014-06-20 actual=+0.50 cons=+0.20 z=+1.56 +50.70p 2014-11-21 actual=+0.10 cons=−0.30 z=+2.03 +46.00p 2016-04-22 actual=+0.60 cons=+0.30 z=+2.08 +55.80p 2017-02-24 actual=+0.90 cons=+0.30 z=+3.31 +12.20p 2018-03-23 actual=+0.60 cons=+0.40 z=+1.55 +48.20p 2018-08-17 actual=+0.50 cons=+0.10 z=+2.56 +46.30p 2019-08-21 actual=+0.50 cons=+0.10 z=+1.70 +12.00p 2020-07-22 actual=+0.80 cons=+0.40 z=+1.88 +4.00p 2022-02-16 actual=+0.90 cons=+0.60 z=+1.99 +2.70p 2022-04-20 actual=+1.40 cons=+0.90 z=+3.46 +18.70p ← median 2022-06-22 actual=+1.40 cons=+1.00 z=+2.41 +2.80p 2023-08-15 actual=+0.60 cons=+0.30 z=+2.09 +27.40p 2025-01-21 actual=−0.40 cons=−0.70 z=+1.60 −20.70p ← miss 2025-03-18 actual=+1.10 cons=+0.60 z=+2.60 −27.80p ← miss 2026-06-22 actual=+1.00 cons=+0.70 z=+1.93 −1.80p ← miss
Three of the four losing prints happened after 2025-01-01, during the BoC’s recent policy transition out of the 2024 cutting cycle. The 2010-08-20 outlier is the fourth: a +0.50 vs 0.00 print landed as big_beat by z-score but was a small absolute miss, and USD-side flows dominated the 15-minute window that day. None of the 2010-2020 big-beat prints went the wrong way. That’s a real trading nuance — CAD inflation surprises push CAD monotonically when BoC’s policy stance is clear, and get faded when the market is uncertain how the BoC will react.
Why the JPY cross beats the USD cross — again
The ledger now has three instances of the same pattern in eight days:
- UK CPI on GBPJPY (2026-08-08) — small-miss n=47 sends GBPJPY down 42 of 47 times, cleaner than GBPUSD.
- CAD Employment on CADJPY (2026-08-08) — big-beat n=23 sends CADJPY up 23 of 23 times, more unanimous than USDCAD.
- Today: CAD CPI m/m on CADJPY — median walk is monotonic, on USDCAD it’s not.
In every case the mechanism is the same: a hawkish domestic-currency print (UK, CAD) strengthens the domestic currency via the rate-differential channel AND weakens JPY via the risk-on channel (hawkish inflation prints correlate with risk-on macro backdrops, and JPY weakens in risk-on flows). Two same-sign pushes on the JPY cross versus one on the USD cross. On CADJPY specifically the second push is smaller than on GBPJPY (because Canada is a smaller economy and CAD is a commodity-cross where JPY’s risk-on/risk-off flow matters relatively more than the size of the CAD reaction), which is why the up-rate is 78.9% on n=19 rather than 42-of-47 = 89.4% on GBPJPY.
What this doesn’t say
The 78.9% up-rate isn’t tight. Per Stats for Traders #3, with n=19 the distribution-free 95% CI for the true up-rate spans roughly 54% to 94%. Point estimate 78.9% is clearly above 50%, but the exact value has wide error bars. Read this as “directional edge is real, magnitude uncertain” — not as “expect ~4 in 5 up prints on the next 5 big-beat releases”.
The 2025-2026 losing streak might mean the mechanism is weakening. Three of the four losing big-beat prints happened in the last 18 months, during a BoC policy transition. If the next couple of big-beat prints also go the wrong way, that would put real pressure on the finding. If the finding is genuine and the 2025 losses were BoC-transition noise, expect the up-rate to recover as the BoC settles into a stable policy path. Worth watching the next 3-4 big-beat releases to distinguish these.
The signal fades past 4h.The chart’s 3D and 5D windows show the ordering breaking down — the 4-hour window is roughly the longest horizon at which the 5-bucket walk still holds cleanly. This is a short-horizon surprise-response, not a multi-day theme trade.
Open the tool → Free forever. No signup. No email required.