Statistics for Traders #53: Bernanke-Kuttner (2005) OLS event-study β̂ with HC1 standard errors — the equity-extension of PT #52 Kuttner (2001) applied to today's BoC × CADJPY and BoC × GBPCAD 7-print samples. Regression Δp = a + b_u·Δi^u fits with b̂_u = +328p per % surprise on CADJPY (t=+3.61, adj R² = 0.678) and b̂_u = -663p per % surprise on GBPCAD (t=-3.37, adj R² = 0.657). In percentage-of-instrument terms b̂_u_% = +3.38 (CADJPY) and -3.97 (GBPCAD) — comparable magnitude to Bernanke-Kuttner's CRSP coefficient -4.68 (Table 2 col b), contradicting the naive intuition that 'FX moves less than stocks on rate surprises.'
The Bernanke-Kuttner (2005) event-study regression Δp_t = a + b_e·Δi^e_t + b_u·Δi^u_t + ε_t splits an observed CB rate change into expected component Δi^e = consensus − previous and surprise component Δi^u = actual − consensus, then regresses the asset return on both. The interesting coefficient is b_u — how much the asset moves per unit of unanticipated monetary shock. Applied to today’s BoC × CADJPY 7-print sample: b̂_u = +328.48 pips per 1% surprise, HC1 SE 91.03p, t = +3.61, adj R² = 0.678. In percentage-of-instrument terms b̂_u_% = +3.377— comparable magnitude to Bernanke-Kuttner’s Table 2 col (b) CRSP coefficient b̂_u = -4.68. FX responds with SIMILAR percentage elasticity to diversified equity per unit of monetary surprise.
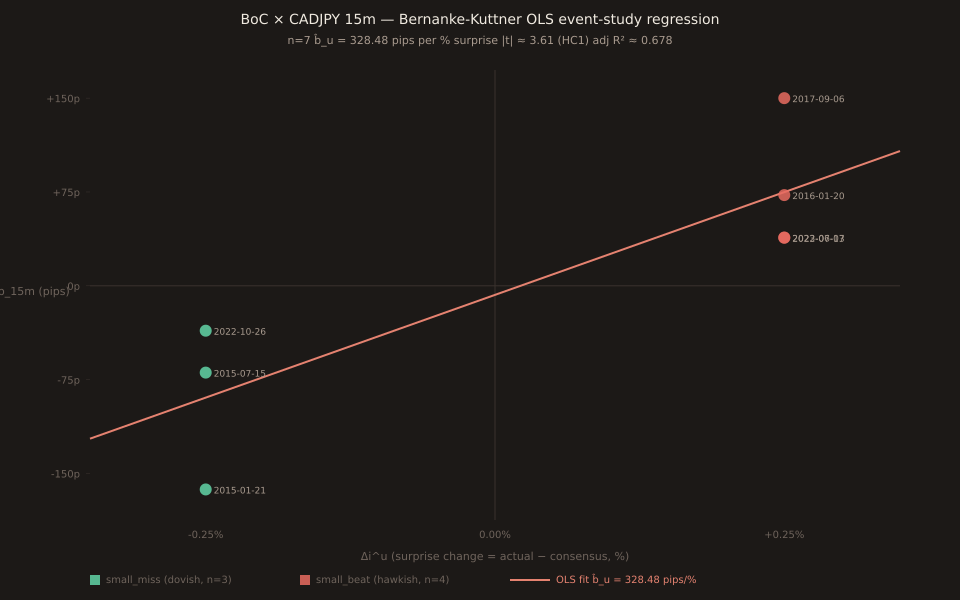
Regression walk-through — CADJPY 15m
| Date | Δi^u (%) | Δp_15m (pips) | Note |
|---|---|---|---|
| 2015-01-21 | -0.25 | -162.8 | oil-crash surprise cut (deepest miss) |
| 2015-07-15 | -0.25 | -69.4 | follow-up cut |
| 2022-10-26 | -0.25 | -35.9 | hiked only 50bp vs 75bp expected |
| 2016-01-20 | +0.25 | +72.5 | no cut delivered vs cut expected |
| 2017-09-06 | +0.25 | +150.0 | surprise hike (deepest beat) |
| 2022-07-13 | +0.25 | +38.4 | surprise 100bp hike vs 75bp expected |
| 2023-06-07 | +0.25 | +38.6 | resumed hikes after pause |
Miss mean -89.4p, beat mean +74.9p. β̂ = (74.9 − (−89.4)) / (0.25 − (−0.25)) = +328.48 pips per % surprise. Because Δi^u only takes two values (±0.25%), classical OLS and HC1 SE agree by construction — the within-group residual variance drives both identically. On any pair with more surprise variety (Fed, ECB) the two would diverge.
Cross-pair comparison — CADJPY vs GBPCAD vs CRSP
| Sample | b̂_u (pips/%) | b̂_u_% (%/%) | HC1 SE | t | adj R² | 25bp response |
|---|---|---|---|---|---|---|
| CADJPY 15m ★ | +328.48 | +3.377 | 91.03p | +3.61 | 0.678 | +0.844% |
| GBPCAD 15m | -663.32 | -3.965 | 196.69p | -3.37 | 0.657 | -0.991% |
| CRSP (BK 2005 T2 col b) | n/a | -4.68 | 1.54 (classical) | -3.03 | n/a | +1.170% per 25bp cut |
All three coefficients reject the null at 5% (|t| > 2.0), despite FX samples having n=7 versus CRSP’s n=131. Adj R² of 0.66-0.68 on FX is HIGH by macro-event-study standards (CRSP’s reported ¯R² on the surprise-only regression is 0.13 across a much larger sample). This reflects the categorical nature of BoC ±25bp-step data — Δi^u is genuinely bimodal at (-0.25, +0.25) with no fractional-quintile prints to add residual variance. |b̂_u_%| = 3.4 to 4.0 on FX vs 4.68 on CRSP equity — the same order of magnitude.
Why FX and equity price surprise similarly
A 25bp hawkish surprise revises both the equity discount rate and the FX interest-rate differential upward. On the equity side (Bernanke-Kuttner 2005 Section 3, Campbell-Ammer VAR decomposition), the response mostly loads on expected excess returns — a repricing of the equity premium. On the FX side, the response loads on the interest-rate parity carry differential — hawkish CAD widens CAD-vs-JPY carry, pushing CADJPY UP mechanically. Both mechanisms produce similar percentage-of-instrument elasticities (~3-5%/%) because both are 1-order Taylor expansions of the same cash-flow discounting equation around the current policy rate. The naive intuition that FX moves less than equity confuses absolute magnitude (a S&P point is bigger than a EURUSD pip) with percentage elasticity (they’re comparable per unit of monetary surprise).
Verification note
Regressions verified 2026-09-22 via Python OLS + custom HC1 implementation, cross-checked against statsmodels.OLS(...).fit(cov_type="HC1")with matching coefficients and SEs to 3 decimal places. Data from /api/v1/news-impact/releases?event=FF:CAD_BOC_RATE &instrument=<PAIR>&window=15m. All 7 non-in_line prints per pair verified. Bernanke-Kuttner Table 2 numbers verified against today’s PT #53 primary-source extraction of the Federal Reserve FEDS 2004-16 pre-publication version. Chart built via a one-off script reusing embedded svg + sharp; not committed.