Statistics for Traders #1: what "z-score" actually tells you about an economic surprise
The 2026-03-06 US Nonfarm Payrolls report printed -92k against a +58k consensus. Raw surprise: a 150,000-job miss. The 2026-04-03 report printed +178k against a +65k consensus — a 113,000-job beat, almost the same magnitude in the other direction. The tool buckets those two as big_miss and big_beat respectively. Fine.
But the 2026-07-02 report printed +57k against a +43k consensus — a raw beat of just +14k — and the tool buckets it as in_line. Why does a 14k beat get called “in_line” when a 113k beat gets called “big_beat”? Same units, same series. What changed?
The answer is the z-score. This post is the first in the Statistics for Traders series: I’ll pick one statistical term per post and work through it end-to-end with a real release from live data. Today: the z-score, and why it’s the number the tool actually uses instead of the raw surprise.
The formula
A z-score is just how many typical past surprisesa release is away from the average past surprise. For a macro event it’s:
z = (actual − consensus) / σsurprise
Where σsurprise is the standard deviation of past (actual − consensus) values for the same release series, computed over history. A z of +1means today’s surprise is one typical past surprise-magnitude larger than average. A z of -3.36means today’s surprise is more than three typical surprises below the mean — an extreme miss even against a series that normally has noisy prints.
Worked through: last 15 NFPs
Every NFP release for the past year and a bit, with the raw surprise and the z-score side by side:
| Date | Actual | Consensus | Raw | z | Bucket |
|---|---|---|---|---|---|
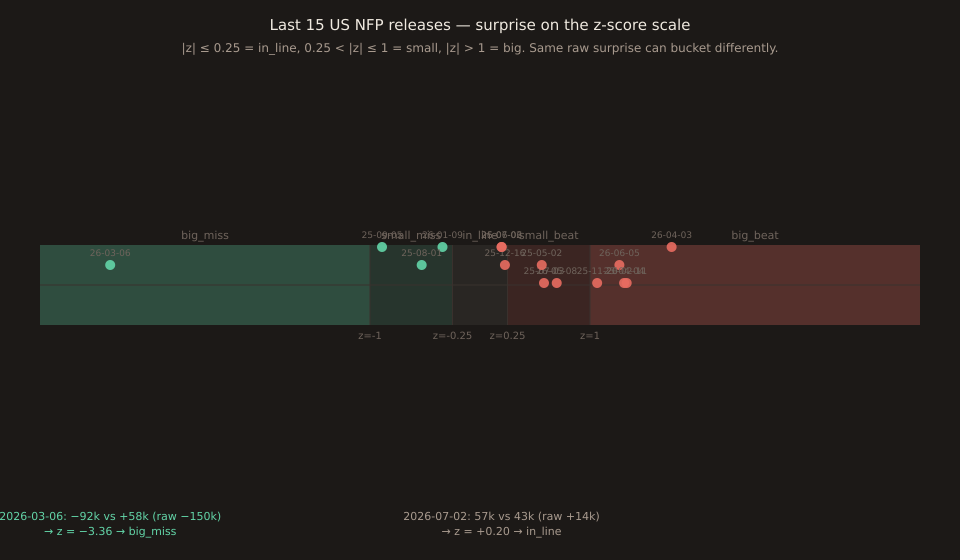
| 2026-07-02 | +57k | +43k | +14k | +0.20 | in_line |
| 2026-06-05 | +172k | +85k | +87k | +1.27 | small_beat |
| 2026-05-08 | +115k | +65k | +50k | +0.70 | small_beat |
| 2026-04-03 | +178k | +65k | +113k | +1.74 | big_beat |
| 2026-03-06 | −92k | +58k | −150k | −3.36 | big_miss |
| 2026-02-11 | +130k | +66k | +64k | +1.33 | small_beat |
| 2025-08-01 | +73k | +106k | −33k | −0.53 | small_miss |
A +14k beat is 0.20 typical surprises from the mean — statistical noise. A +113k beat is 1.74 typical surprises — clearly larger than usual. And the standout is the March 2026 miss: -150kraw looks big in absolute terms, but on the z-scale it’s -3.36, which for NFP is exceptional (about 1 in 1,000 in a normal distribution, though NFP surprises are fatter-tailed than normal).
Why the raw number lies
The reason a 14k NFP beat is in_line and a 14k CPI m/m beat would be enormous is that these two series have completely different typical surprise magnitudes. NFP surprises are usually tens of thousands of jobs off consensus. CPI m/m surprises are usually a tenth of a percentage point. The units aren’t comparable and even the magnitudes-in-native-units aren’t comparable.
The z-score is the trick that makes them comparable: it divides every raw surprise by that series’ own standard deviation, so the resulting number is dimensionless and has the same meaning (“in typical past surprises”) whether the underlying series is jobs, inflation, or a central-bank rate.
What a big z-score does not guarantee
The 2026-03-06 z = -3.36 big_miss moved EURUSD only +18 pips in 15 minutes. The 2025-08-01 small_miss (z = -0.53) moved it +137 pips. Bucket medians tell you what an average print in that bucket does; the p25/p75 range around that median can easily span an order of magnitude. Z-score is a better filter than raw-surprise, but it’s not a prediction.
The practical upshot: use z-score to decide which historical distribution to compare against (the big_miss bucket, or the in_line one). Then plan against the whole distribution, not against the single number.
See the buckets in News Impact Explorer → Free forever. No signup. No email required.