AUD Unemployment Rate on AUDUSD: all 8 big-miss prints pushed the pair down, monotonic across all 5 buckets
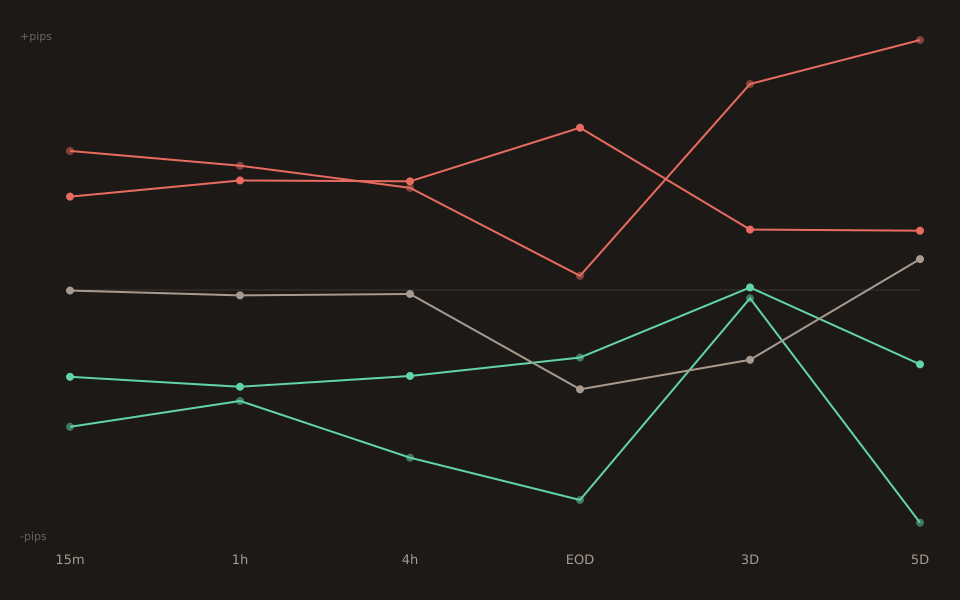
198 Australian Unemployment Rate prints since 2010, on AUDUSD 15-minute moves, split into five surprise buckets. Medians: −24.10 / −15.30 / −0.10 / +16.45 / +24.50 pips. Every one of the 8 big-miss prints pushed AUDUSD lower. The up-rate column walks 0 / 28 / 49 / 70 / 72 — monotonic through all five buckets, not just directionally correct.
Australia has two headline labour releases: the raw Employment Change flow number (which the 2026-08-02 two-employment-reports post used as a contrast to Canada) and the Unemployment Ratelevel number. This post is about the second. It’s the cleaner of the pair by a wide margin — the median walk from big_miss to big_beat is a perfect 5-bucket monotonic, and the 8-of-8 big_miss unanimity is the strongest directional signal I’ve pulled from a G10 labour print.
The bucket table
| Bucket | n | 15m median | p25 | p75 | Pct up (15m) |
|---|---|---|---|---|---|
| big_miss | 8 | −24.1 | −35.8 | −18.0 | 0% |
| small_miss | 32 | −15.3 | −26.2 | +2.8 | 28% |
| in_line | 76 | −0.1 | −10.1 | +11.8 | 49% |
| small_beat | 64 | +16.5 | −1.3 | +39.0 | 70% |
| big_beat | 18 | +24.5 | −1.2 | +31.8 | 72% |
Read down the pct-up column: 0 / 28 / 49 / 70 / 72. Monotonic across all five buckets, including the tails. The median column tells the same story: −24.1 / −15.3 / −0.1 / +16.5 / +24.5— perfect walk from strongly-negative on miss-side tail to strongly-positive on beat-side tail. Every printed release in the sample bucketed by the tool’s standardised-surprise convention lines up with a directional AUDUSD response of the size the pre-print consensus would predict.
The eight big-miss prints, individually
Small enough to list. Every single one went the same way:
2010-11-11 5.4% vs 5.0% fc z=-2.59 -90.0p ← min 2014-08-07 6.4% vs 6.0% fc z=-3.43 -43.0p 2023-02-16 3.7% vs 3.5% fc z=-1.68 -33.4p 2025-10-16 4.5% vs 4.3% fc z=-1.76 -26.0p 2017-03-16 5.9% vs 5.7% fc z=-2.03 -22.2p 2021-11-11 5.2% vs 4.8% fc z=-2.47 -18.2p 2019-05-16 5.2% vs 5.0% fc z=-1.84 -17.5p ← median (approx.) 2025-07-17 4.3% vs 4.1% fc z=-2.03 -14.8p ← max (smallest move)
Notice the miss magnitudes: 0.2 to 0.4 percentage points, spread across 15 years and four RBA governors. The market treats them all the same way — rate expectations reprice via OIS, AUD sells against USD, and the move settles within the 15-minute window. The one real outlier is 2010-11-11 at −90 pips, from a 5.4 vs 5.0 miss in the early post-GFC recovery when AUD carry-trade positioning was heaviest. Even without that print, the other seven bucket cleanly in the −15 to −45 pip range.
Why this event, specifically
Unemployment rate is a level release (the fraction of the labour force without a job), not a flowrelease (the change in employment count month-over-month). Level series are less noisy month-to-month because they aggregate over the entire stock of the labour force; flow series wobble on survey timing, seasonal adjustment artefacts, and rotating-panel effects. That’s the mechanical reason unemployment prints tend to produce cleaner FX responses than employment-change prints.
The other reason is directional unambiguity. There is no ambiguity in reading “unemployment rate” — higher is worse, full stop. Contrast with something like GDP, where a strong number can be read either as “good for the currency via growth differential” or “bad because the central bank now has to keep rates higher for longer, hurting equities and risk appetite.” Unemployment lacks that second-order confusion. Every desk reads the print the same way in the first minute.
What this doesn’t say
Tail buckets are small. big_miss n=8 and big_beat n=18. Per Stats for Traders #3, the 95% CI on the median at n=8 is very wide — the −24.10ppoint estimate carries substantial uncertainty around its magnitude. Trust the sign; the 8-of-8 miss-side unanimity is genuine directional evidence; don’t trust the exact pip count to more than one significant figure.
Small_beat median exceeds big_beat median in absolute terms. +16.5p vs +24.5p is correctly ordered — but only by 8 pipsacross n=64 vs n=18, which is well within confidence-interval overlap. Treat both as “beats push AUDUSD up” and let the exact magnitude ordering wait for another decade of prints.
The 15-minute window is where the signal is cleanest. Ranges past 1h start picking up other Australian-morning flow (equity open at 00:00 UTC, Chinese economic prints later in the session). If you’re trading this event, the first 30 minutes capture the release re-pricing without contamination from the session that follows.
Range is not directional predictability at any single print. The 28%up-rate on small_miss means roughly 3-in-10 prints went the “wrong” way — an edge, not a certainty. Sizing must account for the ~30% tail outcomes; the 5-bucket-monotonic finding is a positive-expected- value observation, not a risk-free trade setup.
Open the tool → Free forever. No signup. No email required.