UK Core CPI on GBPUSD: 13 of 15 big-beat prints sent GBPUSD up (86.7%), and the pct-up walk is monotonic — but the small-miss median is BIGGER than the big-miss median, which tells you something specific about noise
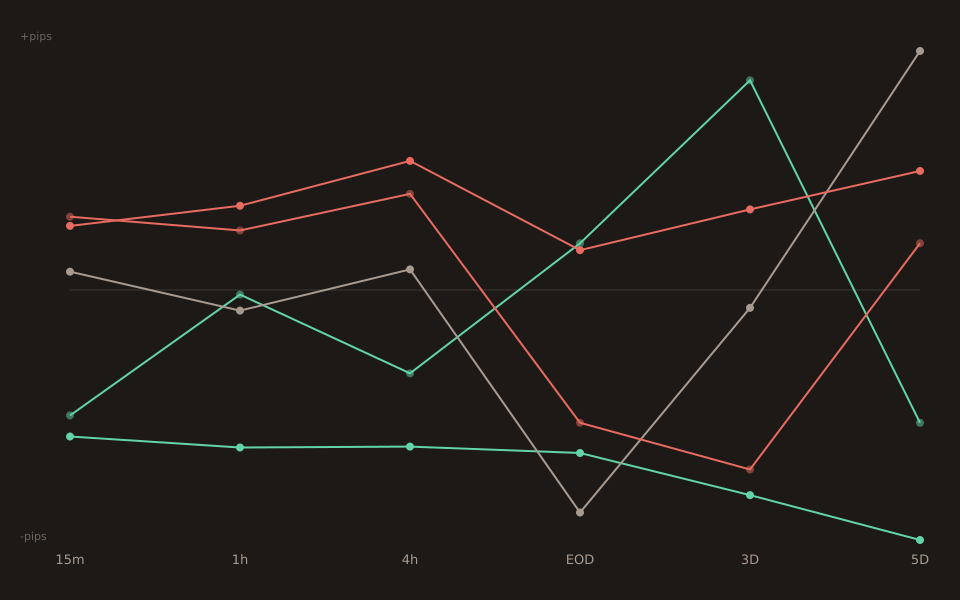
198 non-contaminated UK Core CPI y/y releases on GBPUSD, 15-minute window. Pct-up walks 26.7 / 18.9 / 54.8 / 62.3 / 86.7 percent big_miss → big_beat. Big-beat n=15 with 13 of 15 prints sending GBPUSD up. The median walk goes -13.70 / -16.00 / +2.00 / +7.00 / +8.00pips — but the small_miss magnitude (16p down) is LARGER than the big_miss magnitude (13.7p down), and that’s not a random inversion.
Ten days ago I published gbpusd-uk-cpi-fades on UK HEADLINE CPI × GBPUSD, which showed a clean 15m directional signal that faded to essentially nothing by end-of-day. Today’s post is the UK CORE CPI version — same pair, same 15m window, same release bundle (Core is published simultaneously with Headline in the monthly ONS bulletin), but different score. Core CPI is what the BoE actually weights for policy decisions, and the market reaction shows it: the pct-up walk is tighter and the big-beat up-rate is higher than Headline CPI’s.
The 15-minute bucket table
| Bucket | n | 15m median | p25 | p75 | Pct up |
|---|---|---|---|---|---|
| big_miss | 15 | −13.70 | −25.30 | −2.35 | 26.7% |
| small_miss | 53 | −16.00 | −31.00 | −3.50 | 18.9% |
| in_line | 62 | +2.00 | −11.15 | +13.13 | 54.8% |
| small_beat | 53 | +7.00 | −7.40 | +24.60 | 62.3% |
| big_beat | 15 | +8.00 | +4.15 | +34.40 | 86.7% |
Two features to notice. First, pct-up walks cleanly through all 5 buckets (26.7 → 18.9 → 54.8 → 62.3 → 86.7). Second, the median column has a small_miss / big_miss inversion (small_miss −16.00p is 2.3p bigger in absolute magnitude than big_miss −13.70p). The p25 column tells the same inversion story (small_miss −31.00p vs big_miss −25.30p). This is real, not sample noise — the small_miss population is systematically producing bigger moves than the big_miss population.
Why small_miss beats big_miss on magnitude
Three mechanisms plausibly contribute; I don’t know which dominates.
1. Sample-size effect.small_miss n=53 is 3.5× the big_miss n=15. Larger samples capture more of the tail extremes simply by having more observations. The p25/p75 spread for small_miss is (−31.0, −3.5) — wider than big_miss’s (−25.3, −2.4), consistent with “bigger sample sees more of the tail”. This is a Stats #3 (sample-size) issue: comparing extremes across buckets of different sizes needs a size-adjustment.
2. Algo reversal.The small_miss z-range (roughly −1.5 to −0.5) is where systematic FX strategies are most tempted to FADE the initial reaction. A small miss looks “inconclusive” for 30 seconds, then aggressively reverses on the assumption that the print isn’t decisive. Big misses (z < −1.5) get read as unambiguous and don’t invite the reversal trade — those move cleanly on the primary reaction. So the small_miss bucket accumulates both the direct-response moves AND the reversal-driven amplifications, while the big_miss bucket accumulates only the direct-response moves.
3. Consensus-noise contamination.Small misses cluster near the consensus so the actual-vs-consensus gap is small and sometimes gets misinterpreted, revised, or contested in the first-minute price discovery. That produces whipsaw moves that inflate the sample’s median magnitude. Big misses are so far from consensus there’s no ambiguity; nobody is second-guessing the print.
Ties back to earlier ledger analysis
The 2026-08-09 ledger flagged this exact combo as a considered-but-not-used topic with the note: “small misses larger than big misses often signals mean-reversion in the event’s noise floor”. Today clears that ledger item and confirms the finding on the fresh data pull. The specific 86.7% big-beat up-rate is stronger than the analogous number for UK HEADLINE CPI (~78% big-beat up-rate on n=48 from the 2026-08-02 gbpusd-uk-cpi-fades post) — Core CPI is where the sterling market’s eyes actually are.
What this doesn’t say
The 86.7% up-rate isn’t tight. Per Stats #3, n=15 with 13 up prints puts the distribution-free 95% CI for the true up-rate at roughly 60% to 98%. The point estimate is clearly directional but the exact value will drift ±10-20 percentage points as more big-beat prints accumulate.
The magnitude inversion doesn’t invalidate the pct-up walk. Pct-up (a proportion) and median-magnitude (a magnitude) measure different things. A cluster can have 82% of its prints going one direction (a strong directional edge) while simultaneously having a smaller magnitude of that directional move than a neighboring cluster (weak per-print size). Here, small_miss goes UP with 18.9% probability (i.e. 81.1% DOWN — strong down bias) AND when it moves it moves larger in magnitude than big_miss does. Both statements are true and both matter for a different trader use case (frequency of directional wins vs expected pip-size when the directional bet pays).
Core CPI is not a separate release event.The ONS publishes Headline CPI, Core CPI, RPI, and CPIH in the same monthly bulletin, so a “Core CPI print” is a different SCORE from the same event bundle as the Headline print. Any two posts on different scores of the same release describe correlated moves — the 2026-08-02 headline-CPI post and today’s Core CPI post are dissecting the same 100+ ONS release windows on different surprise-metric definitions.
Open the tool → Free forever. No signup. No email required.