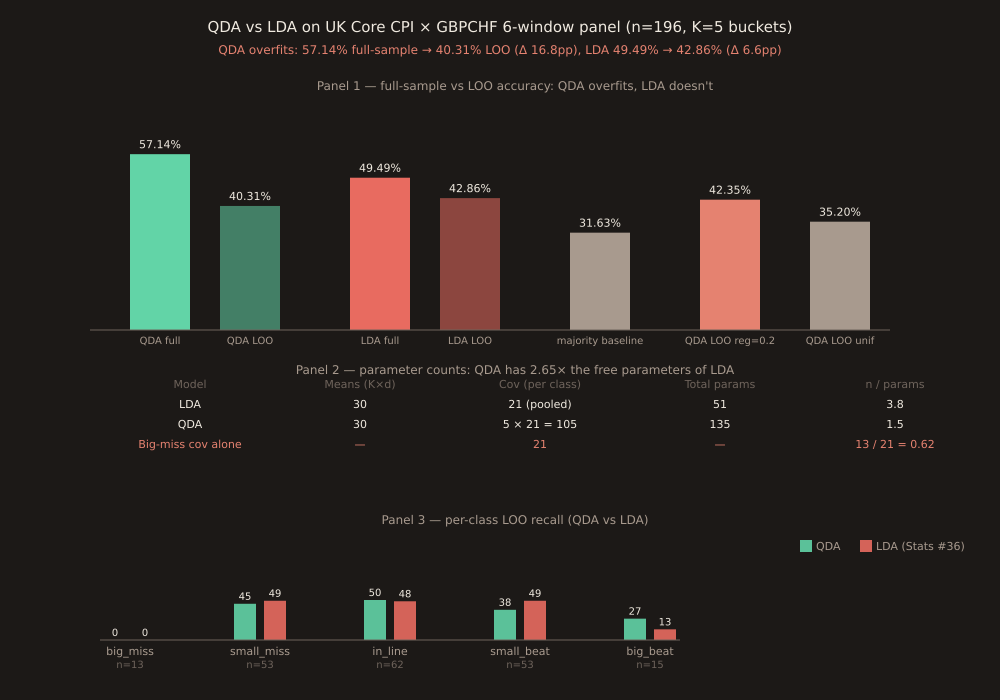
Statistics for Traders #38: QDA on the same UK Core CPI × GBPCHF 6-window response panel Stats #34/#35/#36/#37 used. QDA UNDERPERFORMS LDA on LOO: 79/196 = 40.31% vs LDA's 84/196 = 42.86% (-2.55pp), despite QDA fitting 57.14% in-sample vs LDA's 49.49%. Bias-variance overfitting — QDA's 2.65× extra parameters (135 vs 51) can't be reliably estimated from small tail-bucket samples (n=13 / n=15). Regularized QDA (reg_param=0.20) recovers to LDA-parity 42.35% — confirming the pooled covariance already has essentially all the discriminant information.
Statistics for Traders #38. QDA (Quadratic Discriminant Analysis) on the SAME UK Core CPI × GBPCHF 6-window response panel that Stats #34 (MANOVA), Stats #35 (canonical direction), Stats #36 (LDA), and Stats #37 (Mahalanobis) used. n=196, K=5, d=6. QDA gives each class its OWN 6×6 covariance matrix Σ_k instead of LDA’s pooled Σ.
Headline result: QDA underperforms LDA on out-of-sample LOO despite fitting 7.65pp better in-sample. Full-sample: QDA 112/196 = 57.14% vs LDA 97/196 = 49.49%. LOO: QDA 79/196 = 40.31% vs LDA 84/196 = 42.86%. QDA’s train→test generalization gap is 16.83pp — 2.54× the LDA gap of 6.63pp. Classic bias-variance overfitting story.
The single modeling choice — pooled Σ vs per-class Σ_k
LDA and QDA differ in exactly one assumption: whether the K classes share a covariance matrix. LDA assumes all classes have the SAME Σ, estimates one pooled Σ, and produces LINEAR decision boundaries. QDA relaxes that assumption — each class gets its OWN Σ_k, producing QUADRATIC decision boundaries. The QDA discriminant function is
δ_k(x) = −½ (x−μ_k)ᵀ Σ_k⁻¹ (x−μ_k) − ½ log|Σ_k| + log π_k
with the −½ log|Σ_k| term specific to QDA (LDA has a common −½ log|Σ| that cancels across classes). In theory QDA is strictly more flexible and should do at least as well as LDA when class covariances differ. In practice, on this dataset, the extra flexibility costs more variance than it saves in bias.
Why QDA overfits — parameter counts and observations-per-parameter
| Model | Means (K×d) | Covariance | Total params | n / params | Note |
|---|---|---|---|---|---|
| LDA | 30 | 21 (pooled) | 51 | 3.8 | already below the 10:1 rule of thumb |
| QDA | 30 | 5 × 21 = 105 | 135 | 1.5 | 2.65× LDA parameters |
| QDA (big_miss cov alone) | — | 21 | — | 13/21 = 0.62 | far below 10:1 — pure noise |
| QDA (big_beat cov alone) | — | 21 | — | 15/21 = 0.71 | far below 10:1 — pure noise |
Per-class covariance conditioning confirms the diagnosis: the big_miss covariance matrix has condition number 462 and big_beat has 525 — both roughly 3× the mid-bucket conditioning numbers (~155). Ill-conditioned Σ_k inflates Mahalanobis distances in eigen-directions where the tail-bucket sample happens to have low variance, causing spurious classifications AWAY from those buckets.
Per-class LOO recall — QDA gains big_beat, loses small_beat
| Bucket | n | LDA (Stats #36) | QDA (today) | Δ | Reading |
|---|---|---|---|---|---|
| big_miss | 13 | 0/13 = 0.00% | 0/13 = 0.00% | 0.00pp | log-prior handicap dominates in both |
| small_miss | 53 | 26/53 = 49.06% | 24/53 = 45.28% | -3.78pp | slight loss |
| in_line | 62 | 30/62 = 48.39% | 31/62 = 50.00% | +1.61pp | slight gain |
| small_beat | 53 | 26/53 = 49.06% | 20/53 = 37.74% | -11.32pp | biggest loss — QDA's expanded big_beat bleeds into small_beat |
| big_beat | 15 | 2/15 = 13.33% | 4/15 = 26.67% | +13.34pp | biggest gain — QDA captures fat tails pooled Σ misses |
Only big_beat sees a QDA improvement. QDA gives big_beat its own covariance ellipsoid that captures the fatter tails than pooled Σ recognizes — the +13.34pp recall gain. But this comes at the cost of small_beat losing -11.32pp: the mid-region of small_beat gets partly reclassified as big_beat because QDA’s expanded big_beat likelihood surface bleeds into small_beat territory. Net LOO across all 5 buckets: -2.55pp.
Regularization rescues QDA — up to LDA-parity, not past it
| reg_param λ | LOO acc | Note |
|---|---|---|
| 0.00 | 40.31% | unregularized QDA |
| 0.05 | 41.84% | |
| 0.10 | 41.84% | |
| 0.15 | 41.84% | |
| 0.20 | 42.35% | sweet spot — nearly matches LDA |
| 0.30 | 40.82% | |
| 0.50 | 40.82% | |
| 0.70 | 40.31% | |
| 1.00 | 32.65% | each Σ_k replaced by identity — near-random |
sklearn regularization Σ_k → (1-λ)·Σ_k + λ·I. Best λ is 0.20 and gets QDA to 42.35% — nearly matches LDA’s 42.86%but doesn’t beat it. This tells us: on this dataset, the pooled Σ has essentially all the discriminant information; per-class Σ_k structure adds nothing meaningful once its noise is controlled.
Cross-verification
All numbers cross-verified against sklearn 1.9.0 QuadraticDiscriminantAnalysis(reg_param=0.0) with 100% agreement on both full-sample and LOO predictions. LDA baseline reproduces the Stats #36 result exactly (84/196 = 42.86%). Panel construction (n=196 releases, intersection of all 6 windows) matches Stats #34/#35/#36/#37 exactly — bucket counts big_miss=13, small_miss=53, in_line=62, small_beat=53, big_beat=15 identical.
Practical lesson
Relaxing model assumptions is not automatically an improvement. QDA is more flexible than LDA in theory but on realistic small- sample bucket-classification problems it OVERFITS. The correct next step from LDA when you want more flexibility is not “more parameters per class” but SHRINKAGE toward the pooled model (Friedman’s 1989 Regularized Discriminant Analysis, RDA — a natural follow-up), or a SMALLER feature set (drop from d=6 windows to just 15m/1h — halves the number of covariance parameters). For traders building bucket-classification models: default to LDA over QDA when your tail-bucket sample sizes are below ~10× the number of features. Most macro-news bucket classifications, like this one, don’t have that luxury.