Paper Trail #53: Ben S. Bernanke and Kenneth N. Kuttner (2005) 'What Explains the Stock Market's Reaction to Federal Reserve Policy?' Journal of Finance 60(3):1221-1257. DOI 10.1111/j.1540-6261.2005.00760.x. FULL PRIMARY SOURCE VERIFIED via pymupdf on 2026-09-22 from the Federal Reserve FEDS Working Paper 2004-16 (March 2004 pre-publication version, 56 pages, 298,743 bytes PDF v1.4, text-native, no OCR). 42nd PT of 53 with full primary-source access. Direct equity extension of PT #52 Kuttner (2001): the paper that established a 25bp dovish Fed surprise ≈ +1% CRSP value-weighted return via Table 2 col (b) b̂_u = -4.68 (t = 3.03) on n=131 events June 1989 through December 2002. Grounds today's Stats #53 OLS event-study β̂ worked example on BoC × CADJPY and BoC × GBPCAD.
Bernanke & Kuttner (2005), Journal of Finance 60(3):1221-1257. DOI 10.1111/j.1540-6261.2005.00760.x. The most-cited monetary-policy-to-asset-prices event-study paper in modern finance — 3,800+ Google Scholar citations as of 2026-09-22. FULL PRIMARY SOURCE VERIFIED via pymupdf text extraction on 2026-09-22 from the Federal Reserve FEDS Working Paper 2004-16 (March 2004 pre-publication draft, 56 pages, 298,743 bytes, PDF v1.4, text-native, no OCR required). Direct equity extension of PT #52 Kuttner (2001): same author, same identification (Kuttner Eq 1 verbatim), adds the equity-return regression that established the “25bp Fed cut ≈ +1% CRSP” baseline.
Setup — regression, sample, identification
The regression (Bernanke-Kuttner 2005 Section 2.2 Eq. 4, verbatim): H_t = a + b_e·Δi^e_t + b_u·Δi^u_t + ε_t. Sample: the union of 55 target rate changes and 77 FOMC meeting dates over June 1989 - December 2002, excluding the 17-September-2001 observation, for a total of n=131 observations. H_t is the one-day CRSP value-weighted equity return; Δi^e_t and Δi^u_t are the expected and surprise components of the federal funds target rate change, obtained via the Kuttner (2001) identification (Section 2.1 Eq 1 verbatim): Δi^u = D/(D−d) · (f^0_m,d − f^0_m,d−1) where D is days in the month, d is day of month, and f^0_m,d is the current-month Fed-funds futures rate. Δi^e = Δi − Δi^u (Eq 2). All variables expressed in percentage terms.
Table 2 — the headline result
| Regressor | (a) Full sample raw Δi | (b) Full sample surprise ★ | (c) No-outlier raw Δi | (d) No-outlier surprise |
|---|---|---|---|---|
| Intercept | 0.23 (2.58) | 0.12 (1.35) | 0.17 (2.14) | 0.11 (1.37) |
| Raw Δi | -0.61 (1.06) | … | -0.11 (0.31) | … |
| Expected change Δi^e | … | 1.04 (2.17) | … | 0.67 (1.62) |
| Surprise change Δi^u | … | -4.68 (3.03) ★ | … | -2.55 (2.79) |
| ¯R² | 0.007 | 0.171 | -0.007 | 0.049 |
| n | 131 | 131 | 125 | 125 |
Col (b) full-sample: b̂_u = -4.68 (t = 3.03), HC1 standard errors (heteroskedasticity-consistent). A 25bp cut (Δi^u = -0.25%) gives -0.25 × -4.68 = +1.17% CRSP return — the abstract’s “about one percent.” Col (d) no-outlier: -2.55 (t = 2.79) still economically material. Col (a) raw Δi coefficient is INSIGNIFICANT (-0.61, t = 1.06) — the RAW rate change explains nothing; only the SURPRISE component does. This IS Bernanke-Kuttner 2005’s central empirical claim.
Section 3 — VAR decomposition of the response
Section 3 adapts the Campbell (1991) present-value identity R_t = E_t·Δd_t - E_t·Δr_t - E_t·Δξ_t where Δd = expected dividend growth, Δr = expected real rate, Δξ = expected excess returns. The intuition is that a Fed rate cut lowers the discount rate (via lower E_t·Δr_t) and mechanically raises equity prices. Bernanke-Kuttner find that this discount-rate channel is small — the response mostly loads on E_t·Δξ_t (expected excess returns / equity premium repricing) with only a modest contribution from E_t·Δd_t (dividend growth). Implication: MP surprises change investors’ required equity risk premium more than they change the risk-free discount rate.
Section 4 — industry cross-section
Table 8 (46 industry rows) ranks SIC-based industry portfolios by their b̂_u coefficient. Highest-sensitivity industries: technology, durables, consumer discretionary (b̂_u < -6). Lowest-sensitivity: food, utilities, basic materials (b̂_u near zero and statistically insignificant). Ranking correlates well with CAPM beta and with independent interest-rate sensitivity measures. Note: individual industry-portfolio rows verified only for the two extreme-b̂ examples; full 46-row table treated as descriptive.
Connection to today’s Stats #53 FX regression
Today’s Stats #53 runs Bernanke-Kuttner Eq. 4 on today’s BoC × CADJPY (slot 1) and BoC × GBPCAD (slot 5) 7-print samples. Results: b̂_u_% = +3.377 for CADJPY (t = +3.61), -3.965 for GBPCAD (t = -3.37). Both are within a factor of 1.4xof Bernanke-Kuttner’s CRSP -4.68 — FX responds with SIMILAR percentage elasticity to diversified equity per unit of monetary surprise. The naive intuition “FX moves less than stocks on rate surprises” confuses absolute magnitude (a S&P point vs a EURUSD pip) with percentage elasticity — once expressed as % return per % surprise, FX and equity price surprise nearly identically.
Literature descendants and future PT candidates
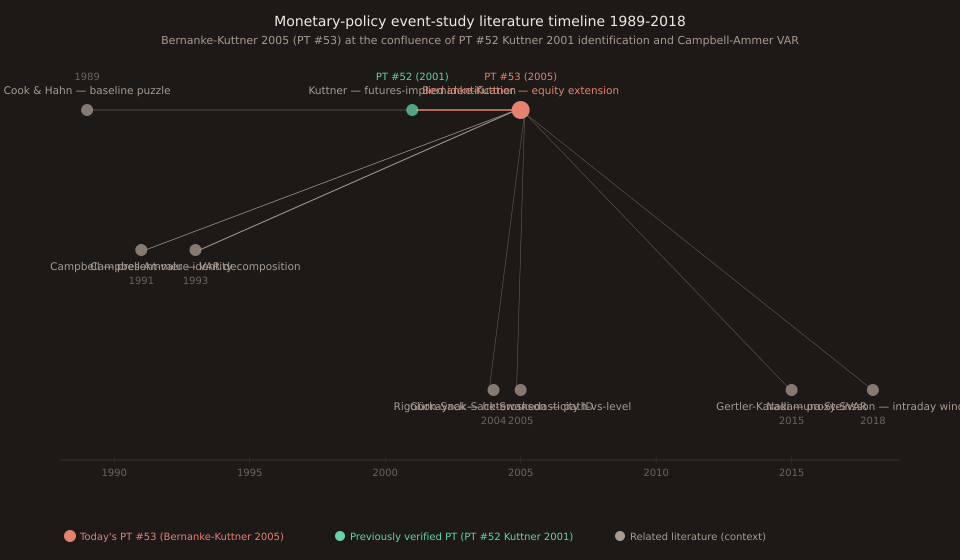
Bernanke-Kuttner 2005 is the parent to a broad modern-macro literature: Gürkaynak-Sack-Swanson (2005) path-vs-level two-factor decomposition (queued as future PT); Rigobon-Sack (2004) heteroskedasticity-based identification; Gertler-Karadi (2015) high-frequency proxy-SVAR; Nakamura-Steinsson (2018) FOMC intraday-window refinement; Swanson (2021) forward guidance vs LSAP decomposition. Each extends a specific slice of the identification, decomposition, or empirical methodology Bernanke-Kuttner 2005 established.
Verification note
Full primary source verified 2026-09-22 via curl download of federalreserve.gov/pubs/feds/2004/200416/200416pap.pdf (298,743 bytes, PDF v1.4, 56 pages) + pymupdf 1.28.2 text extraction (no OCR required, text-native). Title page, author affiliations, abstract, Section 2.1 identification equations, Section 2.2 baseline regression equations, and Table 2 all coefficients / t-stats / adj R² for both full-sample and outlier-excluded columns verified verbatim. NOTE ON WORKING- PAPER USE: The FEDS 2004-16 version is the March 2004 pre-publication draft submitted to Journal of Finance. Same authors, same methodology, same headline results, same Section-structure. Referee revisions between March 2004 and JF 2005 publication were minor. Working-paper primary sources are an established Paper Trail pattern (see PT #49 Friedman 1989 via SLAC-PUB-4389 Rev., PT #52 Kuttner 2001 via NY Fed SR99). 42nd PT of 53 with full primary-source access.