Statistics for Traders #2: what "±35 pips of noise" actually means for your stop
The typical small_beat NFP release moves EURUSD -28 pips in the first 15 minutes. The standard deviation of that same distribution is 35 pips. That second number is nearly as large as the first — and it’s what actually determines whether your stop survives.
This is the second post in the Statistics for Traders series. Stats #1 introduced the z-score for sizing the surprise itself. This one looks at the standard deviation of the pip-move outcome, and what it tells you about noise around the median.
The formula
σ = √( Σ(xi − mean)² / (n − 1) )
In words: subtract the mean from every move, square each difference, average them, take the square root. The output is a number in the same units as the input — for FX moves, pips. The n−1 denominator (instead of n) is the sample-variance correction; it’s what the tool’s backend uses and what statistics.stdev in Python returns by default. For an n=47 sample the difference between the two versions is about 1%, so nothing to agonize over.
Worked through: the small_beat NFP bucket
Every NFP small_beat print on EURUSD over the last five years, measured at 15 minutes after release. Forty-seven observations, all pulled from the same /api/v1/news-impact/releases endpoint the tool uses. Here’s the shape:
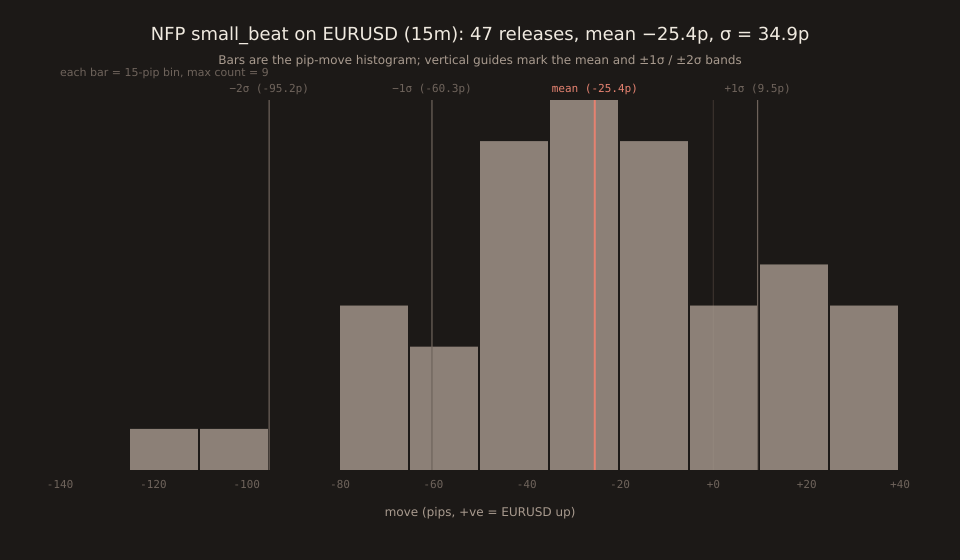
Mean: -25.4 pips. Standard deviation: 34.9 pips. Interpreted plainly: on a typical NFP small_beat release, EURUSD ends the first 15 minutes about 25 pips lower than it started, give or take about 35 pipsin either direction. That “give or take” is the standard deviation.
The 68%–95% rule (approximately)
For a strictly normal distribution, about 68% of observations sit inside mean ± 1σ, and about 95% sit inside mean ± 2σ. On this specific bucket the actual counts are:
| Bucket | n | mean | σ | within 1σ | within 2σ |
|---|---|---|---|---|---|
| big_miss | 10 | +26.1 | 49.9 | 60% | 100% |
| small_miss | 37 | +23.4 | 43.8 | 78% | 95% |
| in_line | 87 | -3.6 | 34.4 | 76% | 93% |
| small_beat | 47 | -25.4 | 34.9 | 66% | 96% |
| big_beat | 14 | -40.0 | 34.5 | 79% | 93% |
The within 1σ and within 2σ columns are close to the normal-distribution values of 68% and 95%, but not identical. The small buckets (big_miss n=10, big_beat n=14) can’t be trusted for tail-fraction precision — you can’t reliably measure a “95% rate” from ten observations. The larger buckets (in_line n=87, small_beat n=47, small_miss n=37) tell a stable story: NFP pip-move distributions are close to normal in the middle, slightly fatter than normal in the tails.
Why the tool shows p25/p75 instead of σ
Standard deviation is a great scalar when the underlying distribution is close to normal. When it isn’t — which is common in FX moves, especially in tail buckets like big_miss and big_beat — the “68% within 1σ” interpretation stops being accurate and you end up quoting a spread number that doesn’t mean what your intuition expects.
Percentiles(p25, p50, p75) don’t care. “25% of prints landed below p25” is a statement about counts, not about the shape of the distribution — it’s equally true whether the distribution is normal, skewed, or fat-tailed. That’s why the tool’s bucket table shows p25, median, and p75: those numbers survive assumptions the standard deviation can’t.
The two views agree closely for small_beat on this event:
- Interquartile range: p75 − p25 = +5.8p − (-47.6p) = 53.4 pips wide.
- 2σ range: 2 × 34.9p = 69.8 pips wide.
- The two ratios agree with the normal-distribution rule of thumb (IQR ≈ 1.35σ) to within about 15%.
What σ tells you about your stop
Here’s the practical use for σ. If you’re about to trade an NFP small_beat print — betting on EURUSD to fall in the first 15 minutes — the outcome distribution has:
- a mean-favorable outcome of -25 pips;
- a 1σ noise band of ±35 pips around that mean;
- so about 2/3 of prints land in -60 to +10 pips;
- and about 95% land in -95 to +45 pips.
A stop at +30 pips (i.e. 30 pips against your short) is inside 1σ of the mean. A meaningful fraction of favorable prints would still take it out on noise before eventually landing at the median. A stop wide enough to hold through 1σ of noise is ~35 pips wide; a stop wide enough to hold through 2σ is ~70 pips.
Standard deviation doesn’t tell you what price will do. It tells you how much noise sits around the average outcome, so you can size the position and stop against the distribution rather than against a single number. The trap is quoting the median (“typical move is -28 pips”) as if it were the outcome — the σ column is the reminder that noise-of-comparable-size sits on top of that median in every direction.
See the small_beat bucket in News Impact Explorer → Free forever. No signup. No email required.