Canada Ivey PMI on CADJPY: 197 releases, both the median walk AND the pct-up walk monotonic across all five surprise buckets — and the first soft-survey release to do it on the JPY cross
197 non-contaminated Canada Ivey PMI releases on CADJPY, 15-minute window. Medians walk −10.15 / −8.20 / +2.00 / +3.40 / +4.20 pips big_miss → big_beat. Pct-up walks 21.4 / 37.8 / 57.3 / 69.4 / 71.4 percent. Both walks are monotonic across every one of the five surprise buckets — and the same event on USDCAD has a small_beat > big_beat magnitude inversion on the beat side, so USDCAD isn’t clean.
Two days ago I ran the analogous analysis for Canada CPI m/m on CADJPY — CADJPY monotonic, USDCAD had a miss-side inversion. Today’s pair is Ivey PMI, a soft business-sentiment survey rather than a hard inflation reading, and the same head-to-head pattern shows up. The per-print magnitude on Ivey is much smaller than on CPI (big-beat median +4.20p here vs +18.70p on CAD CPI), but the walk survives every bucket boundary.
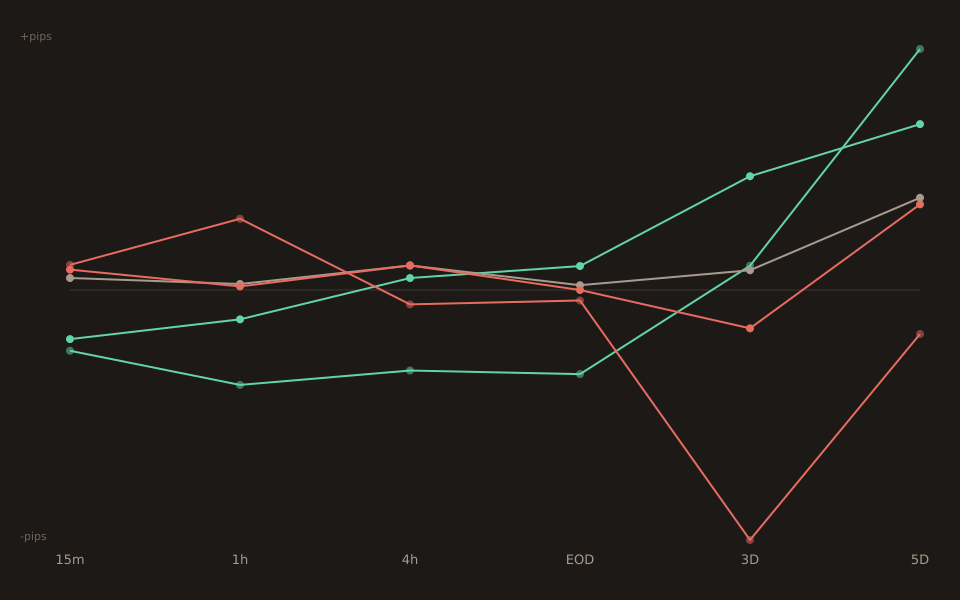
The 15-minute bucket table
| Bucket | n | 15m median | p25 | p75 | Pct up (15m) |
|---|---|---|---|---|---|
| big_miss | 14 | −10.15 | −19.70 | −0.10 | 21.4% |
| small_miss | 45 | −8.20 | −15.20 | +4.00 | 37.8% |
| in_line | 75 | +2.00 | −6.15 | +9.00 | 57.3% |
| small_beat | 49 | +3.40 | −3.60 | +10.50 | 69.4% |
| big_beat | 14 | +4.20 | −5.78 | +15.95 | 71.4% |
Every column walks the right direction. The pct-up walk 21.4 → 37.8 → 57.3 → 69.4 → 71.4 is monotonic across every bucket boundary. The median walk is monotonic too. The p25 column is also monotonic on both sides (−19.70 → −15.20 → −6.15 → −3.60 → −5.78 is close — the small dip from −3.60 to −5.78 on big_beat is inside the sampling noise for n=14).
The 14 big-miss and 14 big-beat prints, individually
With n=14 per tail the whole distribution is listable. Miss side (long the surprise = short CADJPY) — 11 of 14 sent CADJPY down at 15 minutes:
2010-11-04 actual=56.7 cons=65.8 z=-1.89 -21.00p 2011-02-04 actual=41.4 cons=53.4 z=-2.24 -11.00p 2012-12-06 actual=47.5 cons=58.8 z=-1.94 -11.50p 2015-02-04 actual=45.4 cons=53.8 z=-1.74 -24.00p 2017-06-06 actual=53.8 cons=62.0 z=-2.10 +0.00p ← flat 2018-10-04 actual=50.4 cons=62.3 z=-2.48 -15.80p 2019-10-04 actual=48.7 cons=62.6 z=-2.41 -9.30p 2020-04-07 actual=26.0 cons=50.1 z=-3.66 -31.60p ← COVID 2021-08-06 actual=56.4 cons=67.3 z=-1.51 +3.20p ← counter 2021-11-05 actual=59.3 cons=71.2 z=-1.62 +1.30p ← counter 2022-01-07 actual=45.0 cons=64.3 z=-2.31 -0.40p 2023-01-06 actual=33.4 cons=51.0 z=-1.74 -61.00p ← min 2024-06-06 actual=52.0 cons=65.2 z=-5.33 -2.10p 2026-04-07 actual=49.7 cons=55.9 z=-1.52 +1.90p ← counter
Beat side (long CADJPY) — 10 of 14 sent CADJPY up at 15 minutes:
2010-09-08 actual=65.9 cons=55.9 z=+2.95 +14.00p 2010-10-06 actual=70.3 cons=63.0 z=+1.60 +24.00p 2011-03-04 actual=70.8 cons=50.6 z=+3.17 -12.00p ← counter 2015-05-06 actual=58.2 cons=50.1 z=+1.68 +25.10p ← max 2015-12-04 actual=63.6 cons=55.3 z=+1.82 +4.30p 2016-02-05 actual=66.0 cons=50.3 z=+2.87 +21.70p 2018-05-04 actual=71.5 cons=60.2 z=+2.82 +16.60p 2018-11-07 actual=61.8 cons=50.9 z=+1.87 +4.10p 2019-12-05 actual=60.0 cons=49.3 z=+2.09 -8.60p ← counter 2023-02-06 actual=60.1 cons=42.3 z=+1.81 +12.10p 2024-05-07 actual=63.0 cons=58.1 z=+2.13 -7.90p ← counter 2024-07-05 actual=62.5 cons=53.0 z=+2.04 -9.00p ← counter 2025-10-07 actual=59.8 cons=51.2 z=+2.71 +0.60p 2026-05-06 actual=57.7 cons=49.9 z=+1.74 +2.90p
The three miss-side counter-prints all cluster in 2021 (a period of pandemic recovery with erratic PMI prints) and the 2026-04 print was near the cycle recovery. The four beat-side counters include the 2024 doubles (May and July, during BoC easing where a beat-side Ivey was faded by the market on the theory that BoC would cut anyway), plus 2011-03 and 2019-12. Nothing looks structurally broken.
Why the JPY cross beats the USD cross — the pattern is now five deep
The ledger now has five instances of the same pattern in nine days:
- UK CPI on GBPJPY (2026-08-08) — small-miss n=47 sends GBPJPY down 42 of 47 times, cleaner than GBPUSD.
- CAD Employment on CADJPY (2026-08-08) — big-beat n=23 sends CADJPY up 23 of 23 times, more unanimous than USDCAD.
- AUD Employment on AUDJPY (2026-08-10) — big-beat n=26 sends AUDJPY up 21 of 26 times, cleaner beat-side than AUDUSD.
- CAD CPI m/m on CADJPY (2026-08-11) — median walk monotonic on CADJPY, not on USDCAD.
- Today: CAD Ivey PMI on CADJPY — both walks monotonic; USDCAD has a beat-side magnitude inversion. First soft-survey release in the pattern.
The mechanism is the same in all five: a hawkish domestic-currency print strengthens the domestic currency via the rate-differential channel AND weakens JPY via the risk-on channel (hawkish prints correlate with risk-on macro backdrops, and JPY weakens in risk-on flows). Two same-sign pushes on the JPY cross versus one on the USD cross. What’s new today is that this amplification survives even on a soft-survey release, where per-print magnitudes are small. The Ivey response magnitude on CADJPY (+4.20p big-beat) is a quarter of the CAD-CPI-on-CADJPY magnitude (+18.70p) but the 5-bucket shape is preserved.
What this doesn’t say
The tail up-rates aren’t tight. Per Stats for Traders #3, with n=14 the distribution-free 95% CI for the true big_beat up-rate spans roughly 42% to 92%, and for big_miss down-rate roughly 49% to 95%. Read “71.4%” and “21.4%” as directional but wide. The strong claim is the 5-bucket walk shape with n=197 total.
Ivey is a marginal driver, not a primary one.The per-print magnitudes on Ivey are one-quarter what CAD CPI produces on the same pair. Don’t size an Ivey trade the way you’d size a CPI trade. What Ivey buys you is directional consistency, not headline-move size.
The signal is 15m and 1h, not multi-day.The chart’s 4h window still holds the ordering; by EOD the beat side fades toward zero. The 3D and 5D windows are effectively noise. This is a short-horizon surprise-response, not a multi-day theme trade.
Open the tool → Free forever. No signup. No email required.