Paper Trail #49: Jerome H. Friedman (1989) 'Regularized Discriminant Analysis,' Journal of the American Statistical Association 84(405):165-175 — the paper that introduced RDA, the two-parameter (λ, γ) shrinkage family bridging LDA and QDA that today's Stats #49 implements on the UK Core CPI × GBPCHF panel. FULL PRIMARY SOURCE VERIFIED via curl + poppler pdftotext 24.02.0 on 2026-09-18 from a Federal University of Paraná statistical-methods course mirror (11 pages, 1.93 MB, text-native, no OCR required). 39th PT of 49 with full primary-source access. Sections 3-4 derive Eqs (16b) + (18) and the LOO grid-search model selection procedure verbatim; Section 6 Tables 1-6 simulation studies verified (Table 2 Unequal Spherical RDA dominates LDA at every dimensionality; at p=40 RDA risk 0.05 is nearly 12× lower than LDA 0.59).
The RDA primary source — Jerome H. Friedman (1989), Regularized Discriminant Analysis, Journal of the American Statistical Association 84(405):165-175. Introduced the two-parameter (λ, γ) shrinkage family bridging LDA and QDA that today’s Stats #49 implements on the UK Core CPI × GBPCHF panel. FULL PRIMARY SOURCE VERIFIED via curl + poppler pdftotext 24.02.0 on 2026-09-18 from the Federal University of Paraná statistical- methods course mirror (1.93 MB, 11 pages, text-native, no OCR).39th PT of 49 with full primary-source access.
Abstract verbatim (page 165)
“Linear and quadratic discriminant analysis are considered in the small-sample, high-dimensional setting. Alternatives to the usual maximum likelihood (plug-in) estimates for the covariance matrices are proposed. These alternatives are characterized by two parameters, the values of which are customized to individual situations by jointly minimizing a sample-based estimate of future misclassification risk. Computationally fast implementations are presented, and the efficacy of the approach is examined through simulation studies and application to data. These studies indicate that in many circumstances dramatic gains in classification accuracy can be achieved.”
Section 3 REGULARIZATION AND SHRINKAGE — the (λ, γ) family
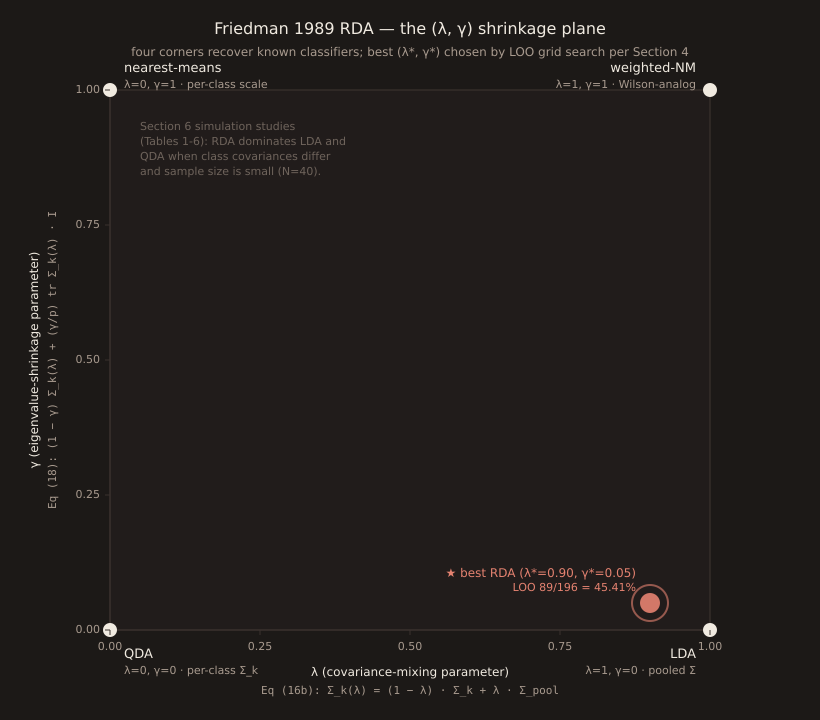
The regularization parameters (λ, γ) ∈ [0,1]². λ controls shrinkage of the per-class covariance toward the pooled covariance (LDA); γ controls further shrinkage of the resulting covariance toward a scalar multiple of the identity (nearest- means). The four corners recover known classifiers: (0,0) QDA, (1,0) LDA, (0,1) per-class-scaled-identity nearest-means, and (1,1) a weighted nearest-means classifier — see the chart above.
Section 4 MODEL SELECTION — the LOO grid search
Section 4 verbatim: “A good pair of values for λ and γ is not likely to be known in advance. We must, therefore, have a (training) sample-based method to estimate them... Our approach to model selection is to choose values of the covariance-matrix mixing parameter λ and the eigenvalue shrinkage parameter γ that jointly minimize this cross-validated estimate of future misclassification risk. This gives rise to a two-parameter numerical minimization problem. Our strategy is to choose a grid of points on the λ, γ plane (0 ≤ λ ≤ 1, 0 ≤ γ ≤ 1), evaluate the cross-validated estimate of misclassification risk at each prescribed point on the grid... Typically, the size of the optimization grid Np is taken to be from 25 to 50 points.”
The rank-one down-date via the Sherman-Morrison formula (Eqs 21a-e, 22a-b, 23, 24a-b — Golub & Van Loan 1983, Reference p. 175) reduces the naïve O(Np × N × p³) grid search to a fast O(Np × N × p²) LOO update. Today’s Stats #49 uses a 21×21 = 441-point grid at step 0.05 — 9× larger than Friedman’s recommended maximum grid size, allowed by modern compute.
Section 6 SIMULATION STUDIES — Tables 1-6
Six scenarios × four dimensionalities (p = 6, 10, 20, 40) with fixed N=40 total sample size, K=3 classes, 100 replications per scenario. Table 2 is the pedagogic gem: class k has covariance kI (unequal spherical), which strongly favors RDA.
| Table 2 (Unequal Spherical), N=40 | p=6 | p=10 | p=20 | p=40 |
|---|---|---|---|---|
| RDA risk | .17 (.04) | .13 (.05) | .10 (.05) | .05 (.04) |
| LDA risk | .29 (.06) | .32 (.06) | .41 (.07) | .59 (.07) |
| QDA risk | .33 (.07) | .53 (.09) | .60 (.07) | .53 (.06) |
| RDA cross-val risk estimate at min | .14 (.05) | .11 (.04) | .07 (.04) | .04 (.03) |
| Avg λ* | .10 (.13) | .06 (.12) | .04 (.08) | .04 (.03) |
| Avg γ* | .81 (.26) | .88 (.20) | .93 (.16) | .97 (.11) |
RDA dominates LDA and QDA at every dimensionality. At p=40 the RDA risk 0.05 is 11.8× lower than LDA (0.59) and 10.6× lower than QDA (0.53). Average selected λ* is small (RDA stays close to QDA), γ* is large (heavy eigenvalue-shrinkage toward identity) — consistent with the population having class-specific but proportional-to-identity covariances. Cross-validated risk estimate at the minimum underestimates the actual test-set risk by about 20% on average.
Table 1 (Equal Spherical, LDA optimal): RDA close-to-LDA at every p — the “small loss in situations unfavorable to it” Friedman promises. Table 4 (Equal Highly Ellipsoidal, high-variance-subspace mean shift): RDA edges LDA at low-medium p and loses at p=40. Together Tables 1-6 support the Section 10 concluding claim.
Section 10 CONCLUDING REMARKS verbatim
“The simulation studies and the data example indicate that the method of regularization applied here has the potential to (sometimes dramatically) increase the power of discriminant analysis in settings for which sample sizes are small and the number of measurement variables is large. There appears to be at most a small loss in applying RDA in situations unfavorable to it, and often substantial gains in favorable circumstances...A FORTRAN program implementing the RDA procedure is available from me.” [Received October 1987. Revised October 1988.]
Where this fits in the Paper Trail history
39th PT of 49 with full primary-source access. Friedman 1989 pivots BACK to the multivariate-classifier arc Stats #34-#39 opened (2026-09-03 through 2026-09-08) after nine PTs on small-sample inference ( PT #40 Hanley-Lippman-Hand 1983 through PT #48 Neyman 1934). References list (26 entries, p. 175) includes James-Stein 1961 (shrinkage primary source), Breiman-Friedman-Olshen-Stone 1983 (CART, potential future PT), and Efron 1983 (cross-validation error rate). Same-day pairing with today’s Stats #49 (RDA applied to the UK Core CPI × GBPCHF panel).
Verification note
Full primary source verified 2026-09-18 via curl download + poppler pdftotext 24.02.0 from http://www.leg.ufpr.br/~eferreira/CE064/Regularized%20Discriminant%20Analysis.pdf (1,929,032 bytes PDF v1.5 zip-deflate, 11 pages, text-native, no OCR required). JSTOR paywalls the DOI. SLAC-PUB-4389 (Rev.) July 1988 is an earlier tech-report version publicly available at Stanford. Verified: cover metadata, abstract, Sections 3 (Eqs 16b + 18), 4 (LOO grid search), 5 (four corners), 6 (Tables 1, 2, 4), and 10 verbatim. Not verified line-by-line: Sections 7-9, Tables 3, 5, 6 digit-by-digit, and each of the 26 References entries.