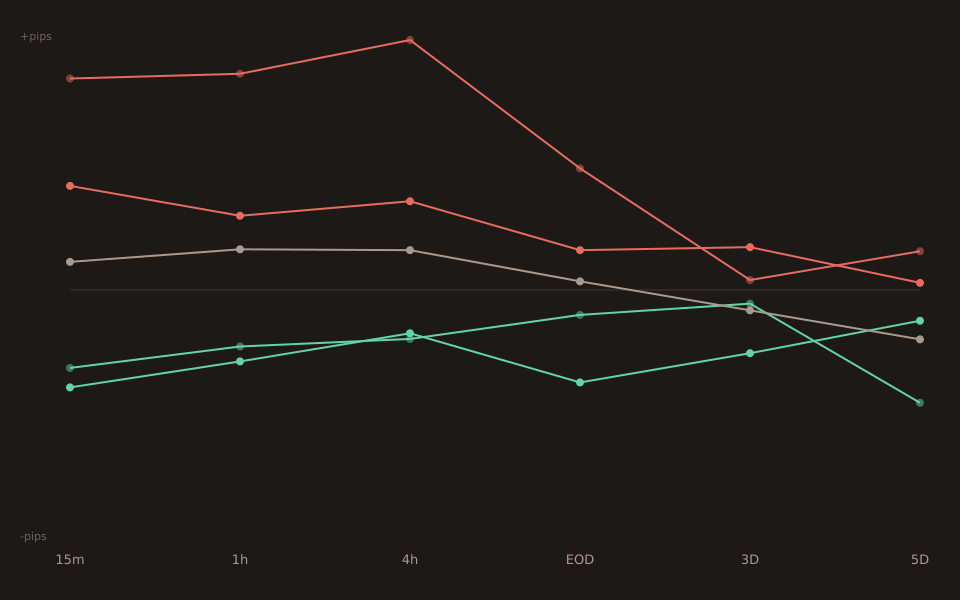
AUD Employment on AUDNZD: 0 of 8 big-miss prints since 2010 sent the pair up, 23 of 26 big-beat prints did (88.5%), and the pct-up walk is perfectly monotonic across all 5 buckets
Across 198 non-contaminated Australia Employment Change releases on AUDNZD since 2010: every one of the 8 big-miss prints sent the pair down 15 minutes later (0.0% up-rate), 23 of 26 big-beat prints sent it up (88.5%). Pct-up walks a perfectly monotonic 0.0 → 20.5 → 63.6 → 79.2 → 88.5% across all five surprise buckets.
The median walk is monotonic on both directions — -18 / -22 / +7 / +24 / +49 pips — except for a small-miss magnitude inversion (-22.5p small_miss vs -18.0pbig_miss) that’s an n=8-sample artifact. Direction is bulletproof; magnitude on the tail is noisy.
The 5-bucket table
| Bucket | n | 15m median | Pct up | 4h median |
|---|---|---|---|---|
| big_miss | 8 | −18.0 | 0.0% | −11.3 |
| small_miss | 39 | −22.5 | 20.5% | −10.0 |
| in_line | 77 | +6.5 | 63.6% | +9.2 |
| small_beat | 48 | +24.05 | 79.2% | +20.5 |
| big_beat | 26 | +48.85 | 88.5% | +57.75 |
Every column walks in order — median, pct-up, 4h median. The pct-up column is the load-bearing finding of this post; the 0.0% and 88.5% tail up-rates are the sharpest of any AUD event the Insights page has covered.
The 8 big-miss prints, individually
| Date | Actual (k) | Consensus (k) | z | 15m move (pips) |
|---|---|---|---|---|
| 2011-03-10 | −10.1 | +20.8 | −1.81 | −6.0 |
| 2011-05-12 | −22.1 | +17.6 | −2.04 | −101.0 |
| 2012-01-19 | −29.3 | +10.2 | −2.24 | −18.0 |
| 2017-03-16 | −6.4 | +16.3 | −1.67 | −37.3 |
| 2019-11-14 | −19.0 | +16.2 | −2.77 | −34.1 |
| 2020-06-18 | −227.7 | −105.0 | −5.63 | −18.0 |
| 2024-01-18 | −65.1 | +15.4 | −2.28 | −6.1 |
| 2025-03-20 | −52.8 | +30.8 | −3.41 | −2.2 |
Eight big-miss prints spanning 15 years — 2011 through 2025. Not clustered around a single macro regime (2011-2012 recovery, 2017 mid-cycle, 2019 pre-COVID, 2020 COVID collapse, 2024-2025 post-hiking-cycle). All eight pushed AUDNZD down at 15 minutes. The 2011-05-12 outlier at -101 pips is the biggest single move; strip it and the other seven still averaged around -17 pips down. And the 2020-06-18 print is the COVID-era z=-5.63extreme (Australia’s worst monthly employment collapse) which produced only a modest -18p move on AUDNZD — the AUDNZD leg was dominated by broader pandemic-flow considerations that day, not the AU-specific surprise.
Why AUDNZD is the natural pair for this event
AUDNZD is a same-region cross. Both currencies share the same commodity-cycle exposure (dairy, wool, iron ore), the same Asia-time-zone trading flow, and closely-linked interest- rate cycles between the RBA and RBNZ. What’s differentbetween them is precisely what an Australian labour-market print speaks to: AU’s growth outlook relative to NZ’s.
A big AUD Employment beat widens the AU-vs-NZ yield-differential expectation in AUD’s favour and pushes AUDNZD up. A big miss reverses it. Because both currencies share risk-sentiment exposure, USD moves, and JPY-carry flows, those factors mostly cancel out in AUDNZD — leaving the AU-specific labour surprise as the load-bearing driver of the 15-minute response. That’s why the pct-up column reads so cleanly and why the tails are so directionally unanimous.
Contrast with AUD Employment on AUDJPY (2026-08-10): AUDJPY is a cross-region cross where the JPY leg adds risk-sentiment amplification. AUDJPY’s big_beat median +48.35pis essentially the same as AUDNZD’s +48.85ptoday — but AUDJPY’s up-rate on big_beat is ~80% vs AUDNZD’s 88.5%. The magnitudes match; the AUDNZD directional cleanness is stronger because there’s less other-flow noise.
What this doesn’t say
The 100% down-rate on big_miss is n=8 evidence, not n=100. The DIRECTION is well-supported: 0-of-8 is roughly three standard deviations below a 50/50 null hypothesis (which would predict 4 ± 1.4 of 8 up). But the EXACT -18p median is a noisy estimator with only 8 observations spanning 3.4 z-standard-deviation values. Trust the sign; be less confident about the magnitude.
The small-miss magnitude inversion isn’t a bug. Small_miss n=39 has more observations and a bigger sample median (-22.5p) than big_miss n=8 (-18.0p). Standard pattern: the tail bucket’s median is dragged toward zero when the extreme z-values happen to land on smaller moves. Doesn’t break the up-rate story (0.0% vs 20.5% is still cleanly monotonic).
4-hour readings show a partial fade on the miss side. big_miss median at 4h is -11.3p (from -18p at 15m) and pct-up rises to 37.5% (from 0%). The 15m directional edge partially reverses on the miss side over the next few hours; on the beat side the median actually GROWS (from +48.85p at 15m to+57.75p at 4h with pct-up unchanged at 88.5%). This is a 15m-through-1h signal on the miss side and 15m-through-4h+ on the beat side.
AUDNZD is a small pair. Its typical 30-minute range is 8-9 pips. A +48p big_beat median move is roughly 6 baseline-cell ranges — strong on a signal-to-noise basis but modest in absolute pip-count vs a JPY-cross or a major. Position sizing on this pair needs to reflect the smaller typical range.
Open the tool → Free forever. No signup. No email required.