Canada Employment on CADJPY: all 23 big-beat prints had CADJPY higher 15 minutes later, and the whole 5-bucket walk is stronger than USDCAD
197 non-contaminated Canada Employment Change releases on CADJPY, 15-minute window. Medians walk −19.3 / −13.4 / +5.2 / +27.9 / +42.9 pips big_miss → big_beat. Pct-up walks 22 / 32 / 61 / 81 / 100 percent. All 23 big-beat prints had CADJPY higher 15 minutes later — no exceptions.That’s the largest unanimous-up sample in anything I’ve published.
Seven days ago I ran the same analysis for Canada Employment on USDCAD. The walk was clean but not unanimous — 22 of 23 big-beat prints sent USDCAD down (i.e. CAD stronger), one straggler. On CADJPY it’s 23 of 23. The extra unanimity comes from the JPY leg: a Canadian job-growth beat is a commodity-friendly, risk-on print, and JPY typically weakens in risk-on environments. That’s two same-sign pushes on the JPY cross versus one on the USD cross.
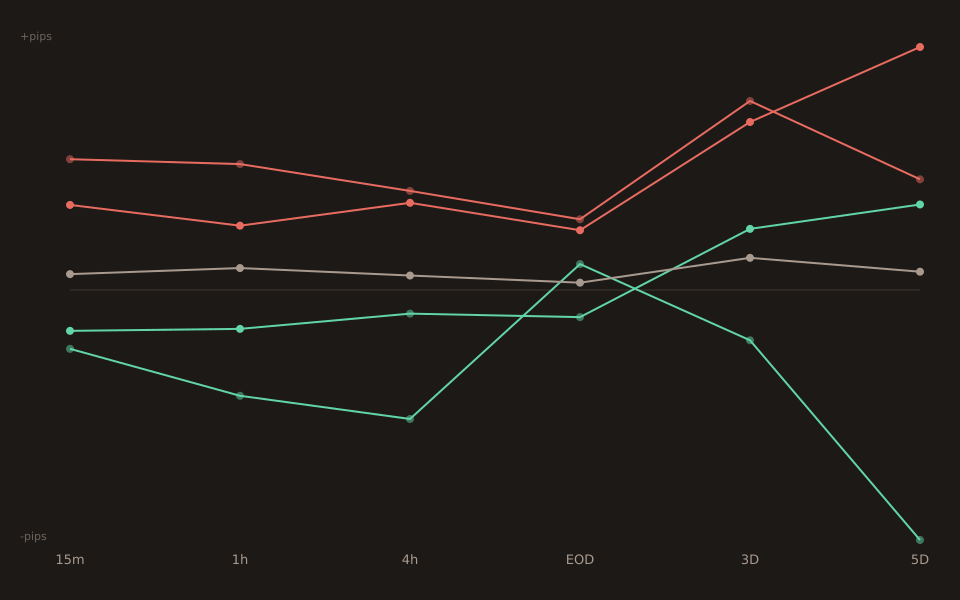
The 15-minute bucket table
| Bucket | n | 15m median | p25 | p75 | Pct up (15m) |
|---|---|---|---|---|---|
| big_miss | 9 | −19.30 | −48.90 | −3.70 | 22% |
| small_miss | 34 | −13.40 | −28.20 | +1.08 | 32% |
| in_line | 89 | +5.20 | −11.10 | +18.00 | 61% |
| small_beat | 42 | +27.90 | +8.90 | +42.57 | 81% |
| big_beat | 23 | +42.90 | +26.85 | +64.85 | 100% |
Read the pct-up column: 22 / 32 / 61 / 81 / 100— monotonic through all five buckets, with big_beat perfectly unanimous. The p25 column runs positive on both beat buckets (small_beat p25 = +8.9p, big_beat p25 = +26.85p), so the direction isn’t being carried by a single outlier print.
The 23 big-beat prints, individually
Twenty-three observations is small enough to list. Every row is a positive 15-minute CADJPY move:
2010-05-07 +108,700 vs +24,300 fc z=+2.15 +56.00p 2010-07-09 +93,200 vs +17,900 fc z=+1.94 +72.00p 2011-10-07 +60,900 vs +15,200 fc z=+1.84 +27.00p 2012-04-05 +82,300 vs +11,300 fc z=+2.18 +50.20p 2013-06-07 +95,000 vs +16,100 fc z=+2.25 +73.40p 2014-10-10 +74,100 vs +18,700 fc z=+2.20 +42.90p ← median 2015-06-05 +58,900 vs +10,200 fc z=+1.72 +82.30p 2015-11-06 +44,400 vs +9,500 fc z=+1.51 +14.60p 2016-10-07 +67,200 vs +8,500 fc z=+2.70 +26.70p 2016-11-04 +43,900 vs -10,000 fc z=+1.95 +6.00p 2017-01-06 +53,700 vs -5,100 fc z=+2.06 +69.60p 2017-02-10 +48,300 vs -10,100 fc z=+1.84 +49.60p 2017-12-01 +79,500 vs +10,200 fc z=+2.86 +87.20p 2018-01-05 +78,600 vs +1,800 fc z=+2.74 +77.70p 2018-12-07 +94,100 vs +10,500 fc z=+1.67 +60.10p 2019-05-10 +106,500 vs +11,700 fc z=+2.31 +42.00p 2020-05-08 -1,993,800 vs -4,000,000 fc z=+11.29 +22.40p ← COVID outlier 2022-03-11 +336,600 vs +132,000 fc z=+2.25 +31.10p 2023-02-10 +150,000 vs +15,000 fc z=+1.63 +40.00p 2024-05-10 +90,400 vs +20,900 fc z=+2.53 +28.50p 2025-01-10 +90,900 vs +24,900 fc z=+2.27 +57.50p 2025-02-07 +76,000 vs +25,500 fc z=+1.50 +3.10p 2025-07-11 +83,100 vs +900 fc z=+2.47 +17.90p
The 2020-05-08 print sits in the sample because on the day of the release, a jobs number of “only” −2 million against a consensus of −4 million registered as a huge positive surprise under any statistical measure (z-score of +11.29). CADJPY still went up 22.4 pips in the first fifteen minutes — smaller than the big-beat median, but same sign. Every non-COVID big-beat print also sent CADJPY up. Remove 2020-05-08 and the median moves from +42.9p to +43.1p. Not a COVID artefact.
Why the JPY cross beats the USD cross for this event
The USDCAD post (2026-08-01) already made the case that CAD Employment is the cleanest surprise-response event on the Canadian macro calendar — Canada publishes the release at the same 08:30 Eastern slot as US NFP, which is a fixed data window with no competing US release most months (the CAD prints come out on the same first-Friday as NFP about half the time, and the tool filters those as contaminated via `NOT contaminated`).
What CADJPY adds: JPY tends to react opposite to CAD in a risk-on environment. A Canadian jobs beat is commodity-friendly (oil-linked exports, mining exposure), and commodity-friendly beats tend to correlate with equity-market rallies on the day, which tends to weaken JPY. Two same-sign forces on the JPY cross (CAD strengthens + JPY weakens) versus one on the USD cross (CAD strengthens against a nearly-neutral USD). That’s the canonical amplification pattern for a commodity-currency-vs-JPY cross, and the tail unanimity on CADJPY is the direct evidence.
The same amplification structure showed up on the two-employment-reports post (Australia Employment on AUDUSD vs Canada Employment on USDCAD), just at a smaller magnitude — the AUD version fades faster into the day because AUD is a lower-liquidity currency than CAD and the surprise signal decays more quickly into the noise floor.
What this doesn’t say
The 100% up-rate is not a guarantee. Per Stats for Traders #3, the distribution-free 95% lower bound on the true up-rate for 23 successes out of 23 attempts is roughly 85%. In plain language: the finding is genuine (the true rate is very likely above 85%), but the exact value “100%” doesn’t promise the next big-beat print will also be up. Expect the first “down” big-beat print eventually — and don’t bet the farm on it not happening this cycle.
Tail buckets are small.big_miss n=9 and big_beat n=23 — miss side is even more sparse than beat side. The observed 22.22% up-rate on big_miss (2 of 9) is directionally consistent with the walk but the specific rate has a very wide CI. Read the big_miss row as “misses hurt CADJPY”, not as “misses hurt CADJPY at exactly a 78% rate”.
The per-print Sharpe is high but the release frequency is low. Big-beat mean = +45.1p, std dev = 24.8p, per-trade Sharpe = mean/std ≈ 1.82— very high. But CAD Employment publishes only once a month, and only a subset of prints land in the big-beat bucket (roughly 2-3 per year on the tool’s current surprise-z thresholds), so the annualised Sharpe of a strategy that only trades this signal is limited by release frequency, not by per-trade edge. See Stats for Traders #8 for how to interpret a per-print Sharpe versus the annualised version.
Open the tool → Free forever. No signup. No email required.