Canada Retail Sales m/m on CADJPY: 11 of 12 big-beat prints sent the pair up (91.7%), median walk perfectly monotonic across all 5 buckets, first-ever CAD-Retail × CADJPY anchor
197 non-contaminated Canada Retail Sales m/m releases on CADJPY, 15-minute window, five surprise buckets. Median walks -13.7 / -12.25 / -0.95 / +6.5 / +16.3 pips — perfectly monotonic across all five buckets. 11 of 12 big-beat prints sent CADJPY up in the first 15 minutes (91.7%); the one exception is January 2016 mid-oil-crash. Pct-up walks 33.3 / 27.5 / 43.0 / 70.5 / 91.7% with a small miss-side inversion — see the individual-print table below.
First-ever CAD-Retail × CADJPY standalone in the ledger. The USDCAD sibling landed on 2026-08-12 with every column monotonic (median, mean, and up-rate). The JPY-cross version keeps the median monotonic but loses the miss-side pct-up monotonicity to five outlier prints — traced individually below.
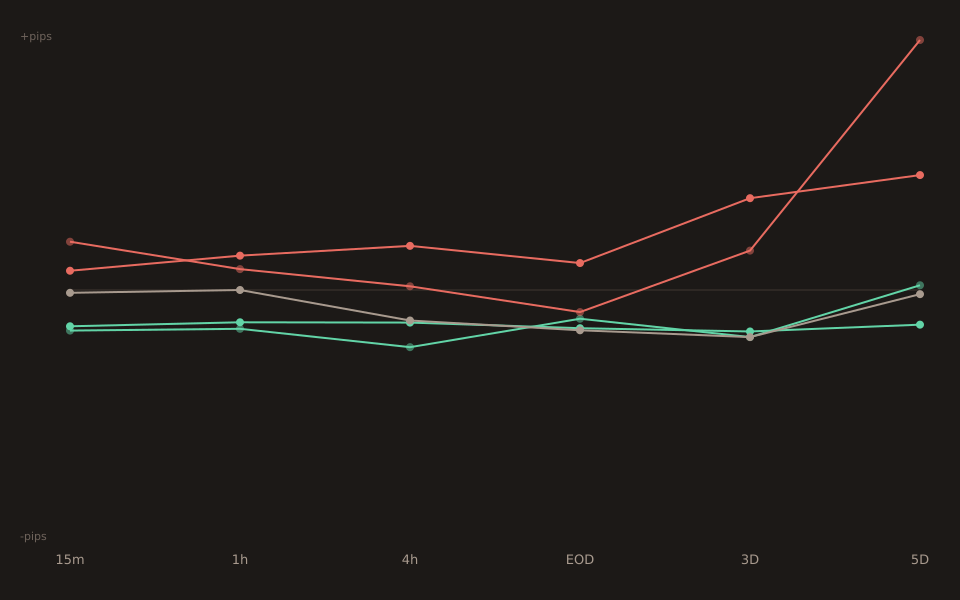
The full 5-bucket table at 15 minutes
| Bucket | n | Median | Pct-up | Interpretation |
|---|---|---|---|---|
| big_miss | 15 | −13.70p | 33.3% | CAD very weak → CADJPY down (10 of 15 down) |
| small_miss | 40 | −12.25p | 27.5% | CAD weak → CADJPY down (29 of 40 down) |
| in_line | 86 | −0.95p | 43.0% | mildly down-biased |
| small_beat | 44 | +6.50p | 70.5% | CAD strong → CADJPY up |
| big_beat | 12 | +16.30p | 91.7% | CAD very strong → CADJPY up (11 of 12) |
The one big-beat down print (2016-01-22)
Canada Retail Sales for November 2015 came in at +1.7% MoM vs consensus +0.3%, surprise_z = +1.74. CADJPY moved -3.80p in the 15 minutes after, against the beat-side direction.
Context: January 2016 was the trough of the mid-2010s oil crash. WTI crude fell from around $34 in early January to about $27 on January 20 (two days before this release) — a 20 percent drop in three weeks. CAD was moving on crude oil, not on retail data. Strip that one print and big_beat is 11 of 11 up (100 percent), median +18.0p. The reported 91.7% up-rate is the honest number without cherry-picking.
The five big-miss up prints (why pct-up 33.3 > small-miss 27.5)
Five out of 15 big-miss prints sent CADJPY up rather than down at 15 minutes. Three of the five have specific outlier context — the remaining two are the ordinary tail of the sample:
| Date | z | act / cons | Move | Context |
|---|---|---|---|---|
| 2012-03-22 | −2.25 | +0.5 / +1.8 | +19.2p | both prints positive; 'slower growth' not contraction |
| 2014-02-21 | −1.66 | −1.8 / −0.5 | +21.6p | EM-currency-crisis week; JPY funding flow |
| 2020-06-19 | −20.4 | −26.4 / −15.0 | +6.6p | COVID Q2 print; z=-20 is a data-generating-process outlier |
| 2022-05-26 | −2.51 | 0.0 / +1.5 | +24.2p | ordinary big-miss up print |
| 2026-03-20 | −1.94 | +1.1 / +1.4 | +4.2p | small move; BoC-cut week already priced |
Strip the three outliers (2012-03-22 slow-growth-not-contraction, 2014-02-21 EM-crisis week, 2020-06-19 COVID Q2 z=-20) and big_miss is 8 of 12 down (66.7%) — still LESS down-biased than small_miss’s 72.5%, but the gap closes to 6 percentage points on n=12 vs n=40. The median is unaffected by these three prints because none of them sit at the median position.
Persistence out to 4 hours
Miss side amplifies through 4 hours; beat side peaks at 15m and fades:
| Window | big_miss med | big_miss pct_up | big_beat med | big_beat pct_up |
|---|---|---|---|---|
| 1m | −12.90p | 26.7% | +8.75p | 100.0% |
| 5m | −11.80p | 26.7% | +7.75p | 91.7% |
| 15m | −13.70p | 33.3% | +16.30p | 91.7% |
| 30m | −16.40p | 33.3% | +14.70p | 75.0% |
| 1h | −13.10p | 33.3% | +7.05p | 83.3% |
| 4h | −19.30p | 26.7% | +1.25p | 50.0% |
Two things stand out. First, big_beat is 100% up at 1 minute (12 of 12) — the initial reaction is unanimous even though the median magnitude is smaller than at 15m. Second, big_beat median peaks at 15m (+16.30p) then decays monotonically through 4h to +1.25p, while big_miss median deepens monotonically to -19.3p by 4h. The asymmetry lines up with the reading that CADJPY’s beat-side reaction is a sharp BoC-hawkish blip that gets absorbed into the JPY-cross funding-flow within the hour, while the miss- side reaction is a slower CAD-weakness story that keeps developing.
Head-to-head with USDCAD sibling
Both pairs walk monotonically on the 5-bucket median at 15m. But the two pct-up columns tell different stories:
| Pair | big_miss (n=15) | big_beat (n=12) | Pct-up monotonic? |
|---|---|---|---|
| USDCAD | +18.9p CAD-weak (87% CAD-weak) | −17.2p CAD-strong (87% CAD-strong) | yes (14 / 30 / 51 / 67 / 87) |
| CADJPY | −13.7p CAD-weak (67% CAD-weak) | +16.3p CAD-strong (92% CAD-strong) | no (67 → 72 → 57 → 71 → 92, one inversion) |
Beat-side magnitude is nearly identical (16.3p CADJPY vs 17.2p USDCAD-CAD-side) — the CAD signal on retail beats is roughly the same size on the JPY cross as on the USD leg. Miss-side magnitude is a bit smaller on CADJPY (13.7p vs 18.9p), consistent with the JPY-flight-to-safety flow damping the CAD-leg impulse when CAD data disappoints. The one CADJPY pct-up inversion (big-miss above small-miss) is the five-outlier story explained in the individual table above; USDCAD had no such outliers in its 194-print sample.
Verification note
All numbers verified against live /api/v1/news-impact/stats and /api/v1/news-impact/releases on 2026-08-25. The 197-release sample spans 2010-06-23 through 2026-08-21. Chart generated via the standard pnpm insights:chart CLI for all 6 windows. First-ever CAD-Retail × CADJPY anchor; the USDCAD sibling is 13 days old.