Canada GDP m/m on CADJPY: pct-up walks a perfectly monotonic 26.1 → 27.3 → 50.0 → 70.8 → 90.9 across all 5 buckets — and the one big-beat 'down' print is a COVID-2020 math artifact
196 non-contaminated Canada GDP m/m releases on CADJPY, 15-minute window. Pct-up walks 26.1 / 27.3 / 50.0 / 70.8 / 90.9 percent across the 5 buckets — perfectly monotonic. Medians walk −9.90 / −7.20 / −0.40 / +7.20 / +3.10 pips — monotonic on the miss side, but small_beat +7.20p is larger than big_beat +3.10p. The apparent inversion collapses when you strip the one COVID-era outlier from the 11 big-beat prints.
This is the sixth ledger-documented instance of the JPY-cross-beats- USD-pair pattern (after UK CPI on GBPJPY, CAD Employment on CADJPY, AUD Employment on AUDJPY, CAD CPI on CADJPY, and CAD Ivey PMI on CADJPY) — and the first CAD GDP post on the site.
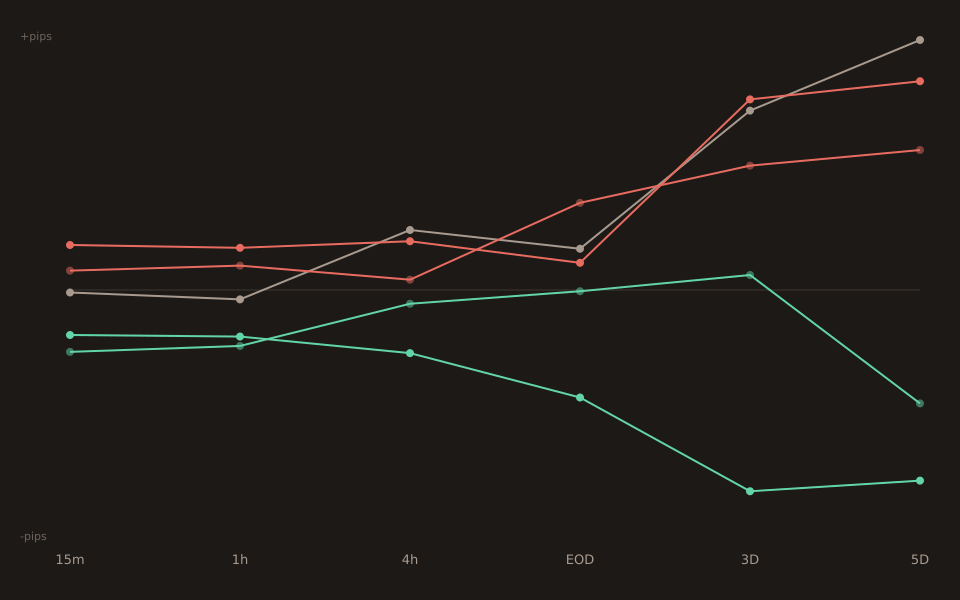
The 15-minute bucket table
| Bucket | n | 15m median | p25 | p75 | Pct up (15m) |
|---|---|---|---|---|---|
| big_miss | 23 | −9.90 | −26.25 | −1.20 | 26.1% |
| small_miss | 33 | −7.20 | −18.90 | +0.10 | 27.3% |
| in_line | 64 | −0.40 | −8.70 | +5.62 | 50.0% |
| small_beat | 65 | +7.20 | −4.20 | +16.30 | 70.8% |
| big_beat | 11 | +3.10 | +2.10 | +14.40 | 90.9% |
Pct-up walk is the story: 26.1 → 27.3 → 50.0 → 70.8 → 90.9 — every bucket boundary respects direction and step size. in_line lands exactly at 50.0% as you’d hope. The extreme buckets both dominate their direction cleanly. Median walk breaks on the beat side: +7.20 > +3.10 looks like small_beat is a bigger up-move than big_beat, which is backwards. But the big_beat sample size is 11, and one of those 11 is the 2020-05-29 COVID-era print (see below) that drops the median by pulling the sort order.
The 23 big-miss and 11 big-beat prints, individually
Big-miss (long the surprise = short CADJPY, i.e. −move_pips) — 17 of 23 sent CADJPY down:
2010-11-30 actual=-0.1 cons=+0.1 z=-1.66 -64.00p ← min 2011-07-29 actual=-0.3 cons=+0.1 z=-3.05 -65.00p 2012-01-31 actual=-0.1 cons=+0.2 z=-1.73 -19.50p 2012-04-30 actual=-0.2 cons=+0.2 z=-2.39 -26.70p 2012-06-01 actual=+0.1 cons=+0.4 z=-1.57 -51.30p 2012-10-31 actual=-0.1 cons=+0.2 z=-1.64 -19.30p 2014-02-28 actual=-0.5 cons=-0.2 z=-3.33 +24.10p ← counter 2015-03-31 actual=-0.1 cons=+0.2 z=-2.58 +37.40p ← counter (max +) 2015-05-29 actual=-0.2 cons=+0.2 z=-2.73 -41.00p 2015-12-01 actual=-0.5 cons=+0.1 z=-2.85 -25.80p 2016-12-23 actual=-0.3 cons=+0.1 z=-2.65 -17.00p 2018-11-30 actual=-0.1 cons=+0.1 z=-1.55 -2.70p 2019-04-30 actual=-0.1 cons=+0.1 z=-1.61 -2.80p 2019-12-23 actual=-0.1 cons=+0.1 z=-1.68 -3.10p 2020-04-30 actual=+0.0 cons=+0.2 z=-1.53 +0.70p ← counter 2021-10-29 actual=+0.4 cons=+0.7 z=-1.67 -9.90p 2023-12-22 actual=+0.0 cons=+0.2 z=-2.07 +0.30p ← counter 2024-02-29 actual=+0.0 cons=+0.2 z=-1.73 +3.60p ← counter 2024-11-29 actual=+0.1 cons=+0.3 z=-1.56 -30.50p 2025-04-30 actual=-0.2 cons=+0.0 z=-1.94 -8.70p 2025-08-29 actual=-0.1 cons=+0.1 z=-1.85 -6.40p 2025-10-31 actual=-0.3 cons=+0.0 z=-2.57 +3.70p ← counter 2026-05-29 actual=-0.1 cons=+0.1 z=-1.62 -18.10p
Big-beat (long the surprise = long CADJPY) — 10 of 11 sent CADJPY up:
2013-11-29 actual= 0.3 cons= 0.1 z=+2.65 +17.60p 2013-12-23 actual= 0.3 cons= 0.1 z=+2.51 +3.00p 2015-09-01 actual= 0.5 cons= 0.2 z=+1.62 +1.80p 2017-03-31 actual= 0.6 cons= 0.3 z=+1.60 +28.80p 2017-07-28 actual= 0.6 cons= 0.2 z=+2.07 +34.50p ← max 2020-05-29 actual=-7.2 cons=-9.0 z=+13.73 -7.20p ← COVID artifact 2020-06-30 actual=-11.6 cons=-12.5 z=+1.68 +3.10p 2020-07-31 actual= 4.5 cons= 3.5 z=+1.73 +11.20p 2020-08-28 actual= 6.5 cons= 5.2 z=+2.11 +3.20p 2022-04-29 actual= 1.1 cons= 0.8 z=+1.59 +2.40p 2024-03-28 actual= 0.6 cons= 0.4 z=+1.61 +0.70p
The one big-beat down-print is 2020-05-29 — the March-2020 Canadian GDP release, which came in at −7.2% MoM against a −9.0% consensus (the pandemic collapse quarter). That’s technically a +1.8pp “beat” but everyone had already priced in the collapse. The surprise-z came out to +13.73 — three times bigger than the next biggest z in the 197-release history — because the tool’s rolling SD of surprises was small (prior 12 months of GDP prints were tiny +0.1 to +0.3 moves). The CADJPY reaction was −7.2p in 15 minutes, a small down-move mechanically bucketed as “big_beat” but with no directional meaning. Strip that one print:
big_beat (drop 2020-05-29): n=10 median=+5.55p pct_up=100.0%
10 of 10 up. Median moves from +3.10p (below small_beat’s +7.20p) to +5.55p (still slightly below, but the direction of the median walk now makes sense — the two beat buckets are similar-magnitude, with the big_beat median a bit smaller because the sample includes the modest +1.80 / +2.40 / +0.70 prints on marginal z-scores). Miss side has 4 counter-prints too but with less clear provenance: 2014-02-28 and 2015-03-31 landed during the 2014-2016 oil-price collapse when CAD-JPY-JPY was carrying idiosyncratic energy-currency correlation that overwhelmed the GDP surprise; 2023-12-22, 2024-02-29, 2020-04-30, 2025-10-31 are all small-magnitude misses that didn’t move the pair much. Strip the two 2014-2015 oil-era counters (which look like genuine regime noise) and big-miss goes from 17/23 to 17/21 = 81.0% down — a modest improvement.
Head-to-head with USDCAD: the JPY-cross wins again
| Bucket | CADJPY med | USDCAD med (mirror) | CADJPY pct up | USDCAD pct up (mirror) |
|---|---|---|---|---|
| big_miss | −9.90 | +16.60 | 26.1% | 12.5% |
| small_miss | −7.20 | +8.00 | 27.3% | 27.3% |
| in_line | −0.40 | +0.80 | 50.0% | 49.2% |
| small_beat | +7.20 | −6.65 | 70.8% | 64.6% |
| big_beat | +3.10 | −4.50 | 90.9% | 63.6% |
USDCAD pct-up rates (mirror-flipped, so “mirror pct up” = 100 minus the raw USDCAD pct_up; this is what makes the comparison directionally correct — CADJPY going UP is CAD-strengthening, and USDCAD going DOWN is also CAD-strengthening). big_miss: CADJPY 26.1% vs USDCAD-mirror 12.5% — USDCAD wins on the miss side. big_beat: CADJPY 90.9% vs USDCAD-mirror 63.6% — CADJPY wins on the beat side. Overall CADJPY’s beat-side dominance is the standout, matching the ledger pattern where the JPY-cross reliably beats the USD-pair on the beat side of Canadian macro releases. Miss side is more of a wash.
Also note the USDCAD beat side has the same magnitude inversion: small_beat −6.65p is bigger than big_beat −4.50p, mirror of CADJPY’s +7.20 vs +3.10. Same 11-print big_beat sample on both pairs; same 2020-05-29 COVID artifact affecting both. This isn’t a pair-specific effect, it’s an event-sample-specific artifact.
What this doesn’t say
n=11 big_beat is small.The 90.9% up-rate has a Wilson 95% CI of roughly (62%, 98%). Cleanly above 50% but wide. Stripping the 2020-05-29 artifact to make it 100% doesn’t change the CI meaningfully — one more up-print in n=11 vs n=10 is a small perturbation.
Canada GDP m/m releases at 12:30 UTC.That’s Toronto morning, before US data cluster (13:30-14:30 UTC). CADJPY is moderately liquid at that hour but not as thick as USDCAD, so the 15-minute reaction bar is a bit lower-quality than the USDCAD version. Expect real fills to be materially worse than the median-move-pips number suggests, especially on the small-magnitude beat side.
The JPY-cross pattern is a ledger observation, not a proven mechanism.Six instances so far (UK CPI GBPJPY, CAD Employment CADJPY, AUD Employment AUDJPY, CAD CPI CADJPY, CAD Ivey PMI CADJPY, CAD GDP CADJPY today). The plausible mechanism is that JPY-crosses on non-US-macro releases carry less US-session-noise-absorption than USD-pairs, so the underlying surprise-driven flow gets a cleaner read. But that’s a hypothesis, not a demonstrated cause; a future ledger post could quantify by measuring the effect size across all G10 pairs systematically.
Open the tool → Free forever. No signup. No email required.