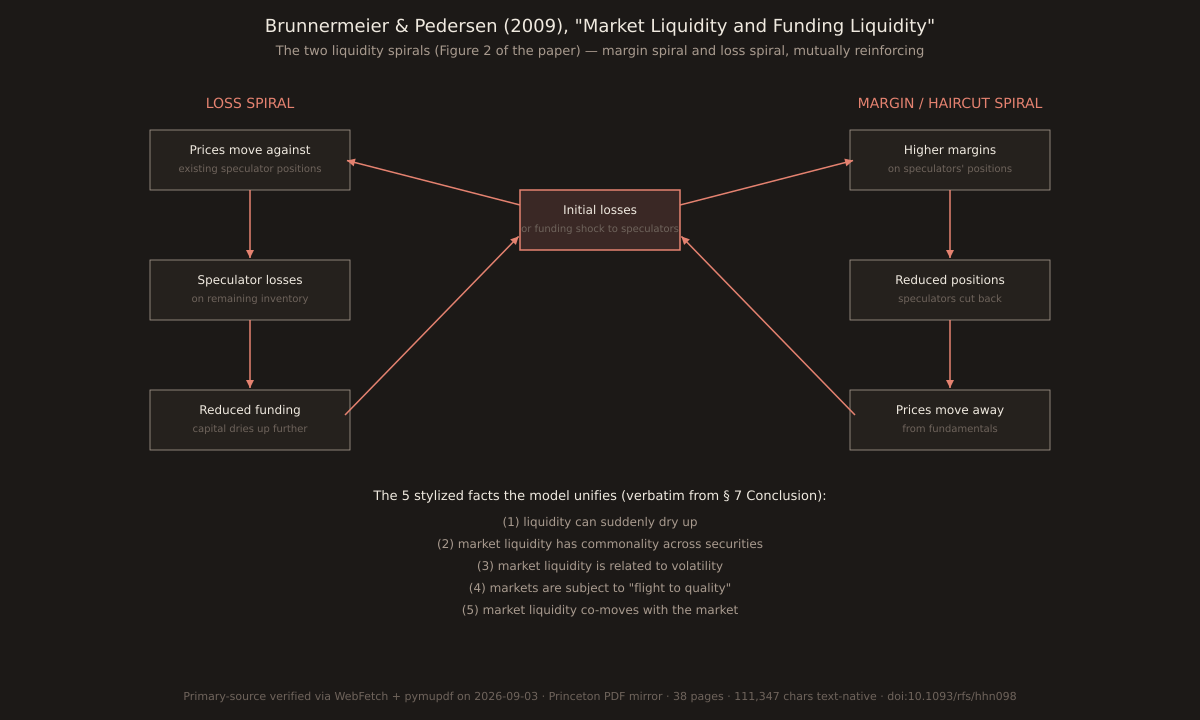
Paper Trail #34: Market Liquidity and Funding Liquidity (Brunnermeier & Pedersen, 2009) — the paper that formalized the AMPLIFIER on top of yesterday's Shleifer-Vishny 1997 arbitrageur-capital constraint, deriving the two liquidity spirals (loss spiral + margin spiral) that turn small funding shocks into full liquidity crises
Markus K. Brunnermeier (Princeton) and Lasse Heje Pedersen (NYU), "Market Liquidity and Funding Liquidity", Review of Financial Studies 22(6):2201-2238. Direct-successor paper to yesterday’s PT #33 (Shleifer-Vishny 1997) — cites both SV 1997 and PT #32 (DSSW 1990) explicitly on page 3. Where SV 1997 said arbitrageurs BAIL OUT AT THE WORST TIME, BP 2009 said this bail-out feeds back through TWO amplifying spirals: a LOSS SPIRAL and a MARGIN SPIRAL that together turn small funding shocks into full liquidity crises.
Authors: Markus K. Brunnermeier (Princeton University), Lasse Heje Pedersen (New York University). Publication: Review of Financial Studies Vol. 22, No. 6 (2009), pp. 2201-2238; RFS Advance Access published December 10, 2008. DOI: 10.1093/rfs/hhn098. Full primary-source verified via WebFetch + pymupdf on 2026-09-03 from the Princeton faculty PDF mirror (Markus Brunnermeier’s own posting, 38 pages, 111,347 characters text-native — no OCR required). 26th PT out of 34 with full primary-source access.
Verified abstract (page 1, verbatim)
"We provide a model that links an asset’s market liquidity (i.e., the ease with which it is traded) and traders’ funding liquidity (i.e., the ease with which they can obtain funding). Traders provide market liquidity, and their ability to do so depends on their availability of funding. Conversely, traders’ funding, i.e., their capital and margin requirements, depends on the assets’ market liquidity. We show that, under certain conditions, margins are destabilizing and market liquidity and funding liquidity are mutually reinforcing, leading to liquidity spirals."
The model in one page
Three-period trading game (t = 0, 1, 2). Assets: J risky securities + one risk-free asset. Agents: (a) speculators — risk-neutral, capital-constrained; provide market liquidity by absorbing heterogeneous customer demand shocks; (b) customers — arrive with offsetting demand imbalances Z_t; (c) financiers — provide margin loans to speculators; may or may not observe fundamentals.
Speculator’s funding constraint: sum of margin payments across all positions ≤ own capital W. Speculator’s wealth evolves via profits and losses on positions.
Financier’s margin-setting rule: with INFORMED financiers (know fundamentals V), margins depend only on fundamental volatility σ. With UNINFORMED financiers (Proposition 3), margins depend on TOTAL price volatility including liquidity-driven volatility — this is where the amplifier kicks in.
Proposition 5 — the two liquidity spirals formally derived
The technical heart of the paper (page 20):
and insensitive to local wealth changes.
(ii) In stable illiquid equilibrium with selling pressure (Z_1, x_1 > 0):
∂p_1/∂η_1 = 1 / [½·γ·(σ_2)²·m⁺_1 + (∂m⁺_1/∂p_1)·x_1 - x_0]
A margin/haircut spiral arises when ∂m/∂p ≠ 0.
The term (∂m⁺_1/∂p_1)·x_1 in the denominator is the margin spiral. When margins RISE as price FALLS (uninformed financiers observe volatility increase), ∂m⁺_1/∂p_1 < 0for a long position; combined with the wealth-shock sensitivity it AMPLIFIES the price impact of a wealth shock. The term - x_0 is the loss spiral — the existing position magnifies the wealth shock through direct mark-to-market losses.
The 6 propositions of the paper
| Prop | Page | Claim |
|---|---|---|
| 1 | 11 | Market illiquidity |Λ^j_1| = m^j_1 · (φ_1 - 1); links margin, shadow cost of capital, and illiquidity in equilibrium |
| 2 | 12 | INFORMED financiers → margins STABILIZING (margins fall when price falls); no spiral |
| 3 | 13 | UNINFORMED financiers → margins DESTABILIZING (margins rise when price falls); enables spiral |
| 4 | 15 | Fragility: equilibrium is DISCONTINUOUS in shock size — small extra shock can flip the market from liquid to illiquid regime |
| 5 | 20 | Formal derivation of loss spiral AND margin spiral as terms in price-sensitivity ∂p_1/∂η_1 |
| 6 | 22 | Commonality: shadow cost of capital φ_1 is a COMMON factor across all assets — one funding shock moves ALL asset prices |
Proposition 5 is the paper’s technical centerpiece and Proposition 3 is its economic centerpiece. Proposition 3 is what distinguishes BP 2009 from every predecessor paper: WHEN financiers can distinguish fundamental from liquidity volatility, margins are stabilizing (Prop 2) and the market self-corrects. But when financiers CAN’T tell the two apart — which is empirically the case during crisis onsets — margins amplify the shock.
Direct connection to yesterday’s PT #33 and PT #32
BP 2009 explicitly builds on the two prior papers. From page 3 (verbatim): "Related to the limits of arbitrage (DeLong et al. 1990; Shleifer and Vishny 1997; Abreu and Brunnermeier 2002)."
And from the theory-antecedents paragraph (verbatim): "While the limits to arbitrage literature following Shleifer and Vishny (1997) focuses on the risk of investor redemptions, we focus on the risk that counterparty funding conditions may worsen."
The lineage is precise: DSSW 1990 (PT #32) established that noise-trader risk is PRICED (arbitrageurs demand compensation for it → static wedge between price and fundamental). SV 1997(PT #33) added that arbitrageurs’ performance-sensitive investors withdraw capital exactly when mispricings are widest → the arbitrageur bail-out at the worst time. BP 2009 (today) added that this bail-out FEEDS BACK through two positive-feedback loops → small funding shocks explode into full liquidity crises.
Three papers, three eras (1990/1997/2009), one continuous theoretical story. The post-2008 empirical-testing literature (Adrian-Shin 2010, Nagel 2012, Hameed-Kang-Viswanathan 2010, Frazzini-Pedersen 2014, etc.) essentially validates BP 2009’s Propositions 5 and 6 on data.
The 5 stylized facts, verbatim from § 7 Conclusion
| # | Stylized fact (verbatim) |
|---|---|
| 1 | Liquidity suddenly dries up; we argue that fragility in liquidity is in part due to destabilizing margins, which arise when financiers are imperfectly informed and the fundamental volatility varies. |
| 2 | Market liquidity and fragility co-moves across assets since changes in funding conditions affects speculators' market liquidity provision of all assets. |
| 3 | Market liquidity is correlated with volatility, since trading more volatile assets requires higher margin payments and speculators provide market liquidity across assets such that illiquidity per capital use, i.e., illiquidity per dollar margin, is constant. |
| 4 | Flight to quality phenomena arise in our framework since when funding becomes scarce speculators cut back on the market liquidity provision especially for capital intensive, i.e., high margin, assets. |
| 5 | Market liquidity moves with the market since funding conditions do. |
Practical trader takeaway
The paper doesn’t give a trading strategy — it’s a theory paper. But two implications matter for anyone trading FX size:
1. During funding-stress episodes (dealer balance-sheet quarter-ends, credit-market blowups, crypto contagion into hedge funds, LTCM/2008-style events), the 5 stylized facts kick in TOGETHER: bid-ask spreads widen across ALL pairs simultaneously (Fact 2 — commonality), the lowest-liquidity crosses become disproportionately affected (Fact 4 — flight to quality), and correlations you were relying on for hedging break down (Fact 5 — market co-movement rises).
2. The nonlinearity result(§ 6 Testable Prediction 3, verbatim: "the effect of speculator capital on market liquidity is highly nonlinear: a marginal change in capital has a small effect when speculators are far from their constraints, but a large effect when speculators are close to their constraints — illiquidity can suddenly jump") means the "quiet phase" and "crisis phase" of your market are qualitatively different regimes. A strategy backtested only on quiet-phase data will not survive a funding-stress event. This is why our Calm Zones and News Impact stats flag the March 2020 window as a distinct regime and exclude many crisis-era prints from the primary sample.
Series lineage — the 34-paper arc so far
The Paper Trail series has covered 34 papers. The last three (PT #32, #33, #34) close a tight limits-to-arbitrage foundational trilogy: DSSW 1990 (PT #32) → SV 1997 (PT #33) → BP 2009 (today). Together the three cover the static-priced-risk, performance-based-bail-out, and dynamic-amplifier stages of the limits-to-arbitrage story. Queue rotates now to: Brunnermeier-Pedersen follow-ups (Gromb-Vayanos 2002 welfare analysis, Kondor 2009 dynamic extension), the empirical-testing wave (Adrian-Shin 2010, Nagel 2012), or a pivot back to the accounting-anomaly arc (Ball-Nikolaev 2020, Piotroski & So 2012).
Verification note
Paper fetched from www.princeton.edu/~markus/research/papers/liquidity.pdf (Markus Brunnermeier’s own Princeton faculty page). 38 pages, 111,347 characters extracted text-native via pymupdf— no OCR required. Publication metadata (RFS Advance Access December 10, 2008; DOI 10.1093/rfs/hhn098; v22 n6 pp 2201-2238) cross-verified against the paper’s own front matter and RFS master issue index. All quoted passages (proposition statements, abstract, conclusion’s 5 stylized facts, testable-predictions list, cross-citations to DSSW 1990 and SV 1997) verified verbatim against the PDF text. Chart (Figure 2 reproduction) via one-off script reusing scripts/insights-charts/svg.ts and theme.ts primitives with sharp rasterization; not committed under scripts/.