CAD Employment on USDCAD is the textbook surprise-response event
196 clean Canada Employment Change releases on USDCAD, 15 minutes after print, bucketed by the surprise size. Big miss: +40 pips median with the pair up 89% of the time. Big beat: -41 pips median with the pair down 83% of the time. In-line: +4 pipsmedian, near-random direction. That’s about as clean as a real-world surprise-response distribution ever gets.
This post walks through why the shape matters, checks whether the direction survives past the first fifteen minutes, and lists the things this data cannot tell you.
The shape of the distribution
| Surprise bucket | n | 15m median | Pct up | Whipsaw |
|---|---|---|---|---|
| big_miss | 9 | +40.2 | 89% | 22% |
| small_miss | 34 | +24.2 | 88% | 18% |
| in_line | 88 | +3.8 | 53% | 22% |
| small_beat | 42 | -30.5 | 14% | 14% |
| big_beat | 23 | -41.0 | 83% | 9% |
The bucket medians step through zero in the correct direction with no detours. A weak jobs print sells CAD and pushes USDCAD up; a strong one does the reverse. What’s uncommon here is the tightness of the directional agreement inside each surprise bucket. In the big beat set, USDCAD closed down 15 minutes later in 83% of cases (n=23), and only 9%of prints saw a whipsaw first. That’s about half the whipsaw rate NFP shows on EURUSD in its decisive tiers.
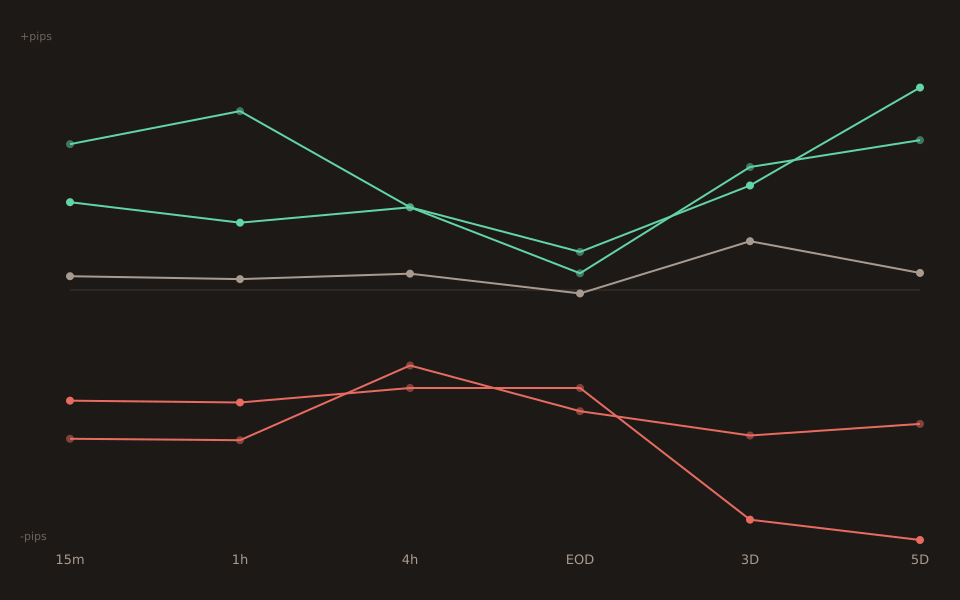
Small sample sizes on the tails matter to note. The big-miss bucket is n=9 and the big-beat bucket is n=23. The ±40 pip medians and the 83%–89% directional-agreement numbers are real, but they’re computed off small samples: don’t treat them as physics. The larger-population buckets (small_beat and small_miss, both n≈40) tell the same directional story with ±25–30 pip medians, and those are the numbers to plan around if you want a more reliable base rate.
Direction holds to end of day
Fifteen-minute reactions are noisy by nature. The interesting question is whether the same directional edge is still visible when the market has had a full session to reconsider.
| Bucket | 15m | 1h | EOD |
|---|---|---|---|
| big_miss | +40.2 | +49.3 | +4.6 |
| small_miss | +24.2 | +18.5 | +10.5 |
| in_line | +3.8 | +3.0 | -0.9 |
| small_beat | -30.5 | -31.0 | -27.0 |
| big_beat | -41.0 | -41.4 | -33.4 |
The beat side of the table is the cleaner story. From -41 pips at 15 minutes to -33 pips at end of day, big_beat holds four-fifths of the initial move. Small_beat holds almost all of it (-30.5 → -27.0). Both bucket signs stay stable across every window, which is what “post-print drift with no mean reversion” looks like when you can actually see it.
The miss side fades. Big_miss collapses from +40 pips at 15m to +5 pips at EOD. Small_miss holds better (+24 → +11). That asymmetry has practical consequences: a durable directional edge exists after a CAD Employment beat, whereas a miss is closer to a short-lived spike that other flows can reverse before the New York close.
What this doesn’t say
It doesn’t say tail buckets are precise. The ±40 pip medians in the big_miss and big_beat buckets are computed off n=9 and n=23 respectively. The tool marks buckets below n=30 as faint for that reason. The direction of the story is robust to the small samples (both big buckets agree with their neighboring small buckets), but the exact medians should not be quoted to one decimal place as if they were a physical constant.
It doesn’t say the next release will conform. The 2025-12-05 print was a small beat that moved -42.8 pips at 15m, right at the median. The 2026-06-05 print was a large numeric beat (+87.8k vs consensus +10.6k) but only bucketed as small_beat once z-scored against history, and it moved -8.8 pips — well inside the p25/p75 range for that bucket, but nowhere near the median. Distributions describe averages, not individual outcomes.
It doesn’t say USDCAD is directional in general.This is specifically a Canada Employment distribution. USDCAD reacts to a lot of things other than Canadian jobs — oil, US CPI, US jobs, BoC meetings, risk sentiment. Each of those has its own separate distribution in the tool, and they don’t combine in a way you can reason about from one bucket chart.
How to use this
Two practical implications for anyone trading Canada Employment on USDCAD.
First, position size against the p25/p75 range, not the median. For the big_beat bucket the range is roughly -64 to -21 pipsat 15m. That’s the middle-half band of actual outcomes, not the top-and-bottom. Stops inside ±20 pips are inside typical noise for the bucket; stops wide enough to contain the p25/p75 have to be at least 40 pips wide.
Second, don’t chase misses to EOD. The beat-side edge holds through the day; the miss-side edge is mostly gone by then. If you’re trading a miss, close the position on the intraday window it was sized for.
Open the tool → Free forever. No signup. No email required.