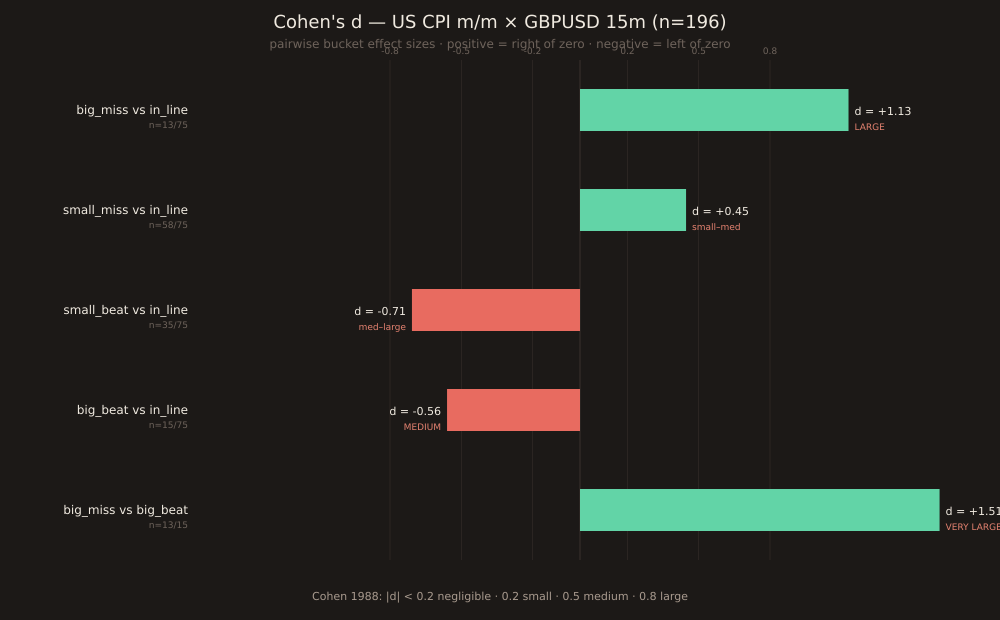
Statistics for Traders #30: Cohen's d on today's slot-1 US CPI × GBPUSD sample — big_miss vs in_line is d = +1.13 (LARGE by Cohen 1988), big_beat vs in_line is only d = -0.56 (MEDIUM), and the miss-side effect is 2× the beat-side effect in effect-size language
Cohen’s d for the 5 buckets of today’s slot-1 sample — US CPI m/m × GBPUSD 15m, n=196. Pairwise bucket-vs-in_line effect sizes: big_miss +1.13, small_miss +0.45, small_beat -0.71, big_beat -0.56. Tail- to-tail big_miss vs big_beat d = +1.51 (VERY LARGE by Cohen 1988). The miss and beat tails are asymmetric even in effect-size language, not just in median/pct-up — miss-side effect is roughly 2× the beat-side effect.
Directly builds on Stats #24 (one-way ANOVA, R², η², Cohen’s f): today’s pairwise Cohen’s d values are the fine-grained pairwise-comparison sibling of Stats #24’s multi-group summary. Grounded in today’s slot 1 so you can see the exact sample the numbers came from.
The formula
Cohen’s d is the standardized mean difference between two groups:
d = (mean_A − mean_B) / s_pooled, where s_pooled = sqrt( ((n_A − 1)·s_A² + (n_B − 1)·s_B²) / (n_A + n_B − 2) ).
It reports the between-group mean difference in units of the within-group standard deviation. Interpretation matches every other standardized effect size: |d| = 1 means the two group means are one pooled-SD apart. Cohen 1988 conventions: |d| < 0.2 negligible; 0.2 small; 0.5 medium; 0.8 large.
Worked example: big_miss vs in_line
big_miss n=13 mean=+33.12p sd=38.19; in_line n=75 mean=+2.06p sd=25.32.
s_pooled = sqrt(((13−1)·38.19² + (75−1)·25.32²) / (13+75−2)) = sqrt((12·1458.24 + 74·641.05) / 86) = sqrt(755.08) = 27.48p.
d = (33.12 − 2.06) / 27.48 = 31.07 / 27.48 = +1.131— LARGE by Cohen 1988 (> 0.8).
All 5 pairwise Cohen’s d values
| Comparison | n_A / n_B | Cohen’s d | Hedges’ g | Cohen 1988 |
|---|---|---|---|---|
| big_miss vs in_line | 13 / 75 | +1.131 | +1.121 | LARGE |
| small_miss vs in_line | 58 / 75 | +0.447 | +0.444 | small-medium |
| small_beat vs in_line | 35 / 75 | -0.708 | -0.702 | medium-large |
| big_beat vs in_line | 15 / 75 | -0.560 | -0.555 | MEDIUM |
| big_miss vs big_beat (tail-to-tail) | 13 / 15 | +1.514 | +1.470 | VERY LARGE |
The miss-vs-beat asymmetry, in effect-size language
big_miss vs in_line d = +1.13 is LARGE by Cohen 1988. big_beat vs in_line d = -0.56 is only MEDIUM. The miss-side effect is roughly 2× the beat-side effect in standardized-mean-difference units — matches the 15m median asymmetry (+18.5p miss vs -6.4p beat) and the pct-up asymmetry (92.3% vs 26.7%). This is a structural feature of the sample: the miss side has both a bigger mean-shift AND wider variance (sd 38 vs 19), and the two effects partly cancel in the ratio.
The adjacent bucket-boundary artefact, in Cohen’s d language
Adjacent small_beat vs big_beat d = -0.22 — the wrong sign. small_beat n=35 mean -19.35p is MORE NEGATIVE than big_beat n=15 mean -11.64p. Same bucket-boundary artefact this ledger has documented on GBPAUD (2026-08-28) and today’s EURAUD slot 5: a small-n big_beat bucket (n=15) contains dampeners (4 counter-directional prints per slot 1’s release-level inspection) that pull its mean toward zero, making the standardized comparison flip against the adjacent-bucket expected ordering. The median walk (robust to outliers) doesn’t show this flip; only the mean-based Cohen’s d does — one honest reason to prefer median walks over mean walks when reading bucket signal.
The tail-to-tail d as bucket-filter effect size
big_miss vs big_beat d = +1.51 is the effect size actually available to a bucket-filter strategy that trades only the two tail buckets (long GBPUSD on big_miss, short on big_beat). At d = 1.5, roughly 93%of the two tail distributions don’t overlap (Cohen 1988 Table 2.2 — U₃ overlap statistic). By contrast, the overall Pearson r between surprise_z and move_pips across all 196 releases (with in_line and small_* buckets included) is only about -0.30 — misleadingly modest because it dilutes the tail signal with 75 in_line prints where there’s nothing to trade.
Hedges’ g small-sample bias correction
g = d · (1 - 3 / (4·(n_A + n_B) - 9)) — Hedges 1981 proved this correction removes the positive bias in d as a small-sample estimator of the population effect size δ.
For big_miss (n=13) vs in_line (n=75): correction = 1 - 3/343 = 0.9913 (0.87% shrinkage). For tail-to-tail big_miss vs big_beat (n=13 vs n=15): correction = 1 - 3/103 = 0.9709 (2.90% shrinkage — biggest of the pairwise pairs because both samples are small). At n ≥ 40 per group the correction drops below 0.5% and is rarely worth reporting; at n = 13/15 it’s material — the tail-to- tail d = +1.514 becomes g = +1.470, still VERY LARGE, but ~3% smaller.
Verification note
All numbers computed 2026-08-30 in Python numpy against the full 196-release /api/v1/news-impact/releasesresponse for FF:US_CPI_MOM × GBPUSD, non_contaminated, window=15m. Formulas match Cohen (1988) "Statistical Power Analysis for the Behavioral Sciences" §2.2 (d) and Hedges (1981) "Distribution Theory for Glass’s Estimator of Effect Size and Related Estimators" Journal of Educational Statistics 6(2) (g). Chart via a scratch script reusing scripts/insights-charts/svg.ts and theme.ts primitives with sharp rasterization (not committed under scripts/).