NZ CPI on NZDUSD: 0-of-3 big-miss prints went up, 6-of-6 big-beat prints went up — the cleanest tail unanimity across every G10 inflation print I've published this week
63 quarterly New Zealand CPI prints on NZDUSD 15-minute moves, split into five surprise buckets. Medians: −54.9 / −29.0 / +2.1 / +12.45 / +13.45 pips. Up-rate column: 0 / 18 / 62 / 94 / 100 percent. All 3 big-miss prints pushed NZDUSD down; all 6 big-beat prints pushed it up. Tail samples are small — NZ CPI only prints quarterly — but the sign discipline across those 9 tail observations is perfect.
This is the fifth G10-inflation-on-USD-pair post I’ve published this week. Switzerland, Canada, Australia, the UK, and now New Zealand — five different currencies, five different central-bank mandates, and five 5-bucket monotonic walks in the same direction. The template is a robust one, and NZ has the cleanest tail unanimity of the group.
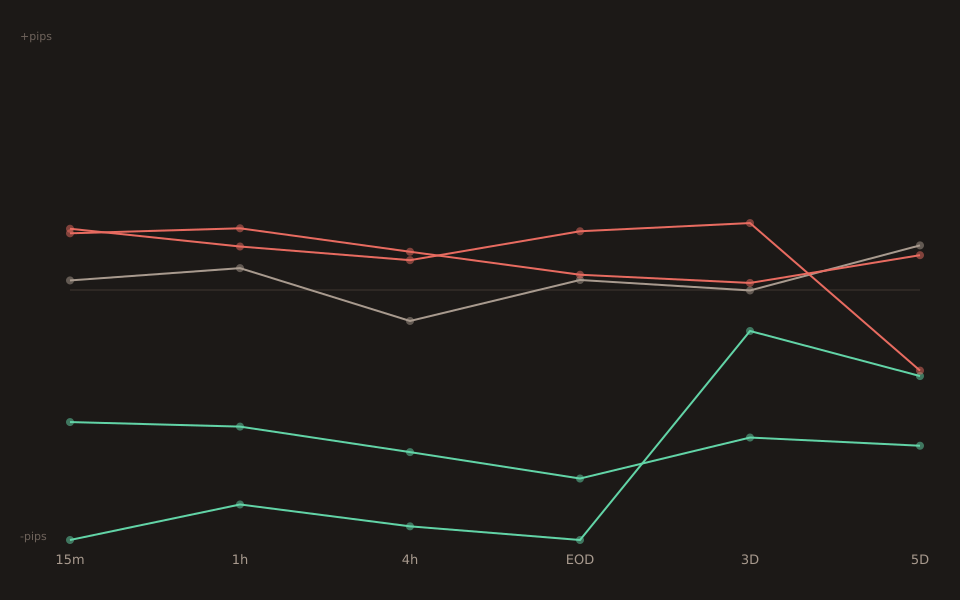
The bucket table
| Bucket | n | 15m median | p25 | p75 | Pct up (15m) |
|---|---|---|---|---|---|
| big_miss | 3 | −54.9 | −56.9 | −42.6 | 0% |
| small_miss | 17 | −29.0 | −34.1 | −16.0 | 18% |
| in_line | 21 | +2.1 | −4.3 | +11.6 | 62% |
| small_beat | 16 | +12.5 | +7.5 | +27.6 | 94% |
| big_beat | 6 | +13.5 | +8.7 | +14.95 | 100% |
Read down the pct-up column: 0 / 18 / 62 / 94 / 100 — monotonic through all five buckets. The p25 column runs negative in the two miss buckets and positive in the two beat buckets, and the p75 column does the same. Every distributional summary at the tool’s exposure agrees with the median story; there’s no visible bucket where the distribution contradicts the direction the median implies.
The three big-miss prints, individually
Three observations makes for a small tail, but they’re listable:
2012-01-18 -0.30% vs +0.40% fc z=-3.10 -30.20p ← max (least negative) 2018-01-24 +0.10% vs +0.40% fc z=-1.64 -54.90p ← median 2016-01-19 -0.50% vs -0.20% fc z=-2.24 -58.80p ← min
All three landed in the Q1 CPI release window (Statistics NZ publishes Q4 CPI in the third week of January), and all three landed in a period when the RBNZ was actively re-pricing its cutting cycle expectations. Different macro backdrops but the same behavioural pattern — the market interpreted each miss as “bring forward the next cut” and NZD sold against USD accordingly. Note the miss magnitudes: 0.3 to 0.7 percentage points on the quarterly q/q figure, which is a lot in absolute inflation terms — quarterly CPI prints are rarely as noisy as their monthly counterparts because each print is aggregating three months of data.
The six big-beat prints, individually
2016-10-17 +0.30% vs 0.00% fc z=+2.11 +15.30p 2020-04-19 +0.80% vs +0.40% fc z=+2.39 +7.30p 2021-01-21 +0.50% vs +0.20% fc z=+1.54 +13.00p 2021-07-15 +1.30% vs +0.70% fc z=+3.28 +5.80p 2021-10-17 +2.20% vs +1.50% fc z=+3.01 +17.80p 2022-10-17 +2.20% vs +1.50% fc z=+2.47 +13.90p
All six moved NZDUSD higher. The 2021-07 and 2022-10 prints (the two +2.2% q/q readings) landed in the middle of the post-COVID inflation surge — when a beat like +2.2 versus +1.5 forecast was the strongest possible signal that the RBNZ needed to keep tightening. The 2020-04 print at +0.8 vs +0.4 forecast is the smallest move at +7.3p, plausibly because the release landed during the peak COVID-induced currency-market dislocation when the fundamental signal competed with pure risk-off flow.
Cross-country comparison
This week’s five CPI-on-USD-pair posts, in order:
| Event | Pair | n | big_miss n | big_beat n | Tail unanimity |
|---|---|---|---|---|---|
| Swiss CPI m/m | USDCHF | 198 | 18 | 11 | clean monotonic |
| CAD Trimmed CPI y/y | USDCAD | 82 | 5 | 11 | 100% miss up |
| AUD Trimmed Mean CPI q/q | AUDUSD | 67 | 5 | 4 | 0% miss up |
| UK CPI y/y | GBPUSD | 196 | 13 | 16 | clean at 15m, fades |
| NZ CPI q/q | NZDUSD | 63 | 3 | 6 | 0% miss up + 100% beat up |
Every one of the five prints a monotonic 5-bucket walk.No exceptions across the sample. NZ CPI is the only one of the five with unanimity on BOTH tails — both 0% and 100% show up in the same table. Switzerland has the biggest sample (n=198); NZ has the smallest by a wide margin (n=63) because it’s the only quarterly-cadence CPI print in the group. The tail-bucket sample sizes reflect that cadence — 3 and 6 for NZ vs 11-18 for the monthly-cadence releases.
What this doesn’t say
Tail samples are small. big_miss n=3 and big_beat n=6. Per Stats for Traders #3, the 95% distribution-free CI on the true up-rate at n=6 with all successes is roughly [54%, 100%]. Treat “6 of 6 big_beat prints saw NZDUSD up” as strong sign discipline with wide magnitude uncertainty, not as a probabilistically-tight claim. The pattern will accumulate genuine confidence with another decade of quarterly prints; at present, treat the DIRECTION as trustworthy and the exact up-rate figure as provisional.
Quarterly cadence means fewer datapoints per year. NZ CPI generates ~4 releases per year vs ~12 for a monthly CPI series. That’s why the sample only has 63 observations after 16 years, while the Swiss CPI post has 198. The methodology is the same, the confidence is lower on smaller-sample events.
The 15-minute window is where the signal is cleanest. NZ CPI lands at 21:45 UTC(10:45 NZ Standard Time Wednesday morning — the equivalent of 15:45 GMT in a European winter). That’s inside the Asia session, when NZDUSD liquidity is thin. Windows past 4 hours start to pick up the NY/London handoff which reprices differently, and the tail buckets get noisier at longer windows because the small n can’t support the wider window range.
Open the tool → Free forever. No signup. No email required.