CAD Unemployment on USDCAD: 22 of 26 big-beat prints sent USDCAD down, and the whole 5-bucket walk is monotonic across every window from 1 minute to 4 hours
196 non-contaminated Canada Unemployment Rate releases on USDCAD, 15-minute window. Medians walk +15.1 / +19.5 / +4.5 / -10.9 / -39.3 pips big_miss → big_beat. Pct-up walks 70 / 79 / 54 / 36 / 15 percent. 22 of 26 big-beat prints sent USDCAD down. The whole 5-bucket walk is monotonic on median at every window from 1 minute out to 4 hours.
This is the third Canadian labour post in the batch — completing the trilogy after Canada Employment Change on USDCAD (2026-08-01) and Canada Employment Change on CADJPY (2026-08-08). All three trade the same way: a Canadian labour improvement pushes CAD stronger against the US dollar (and even more strongly against the yen). Unemployment Rate is the second cell on the same StatCan Labour Force Survey release, and it moves USDCAD with the same directional cleanliness as its sister Employment Change number.
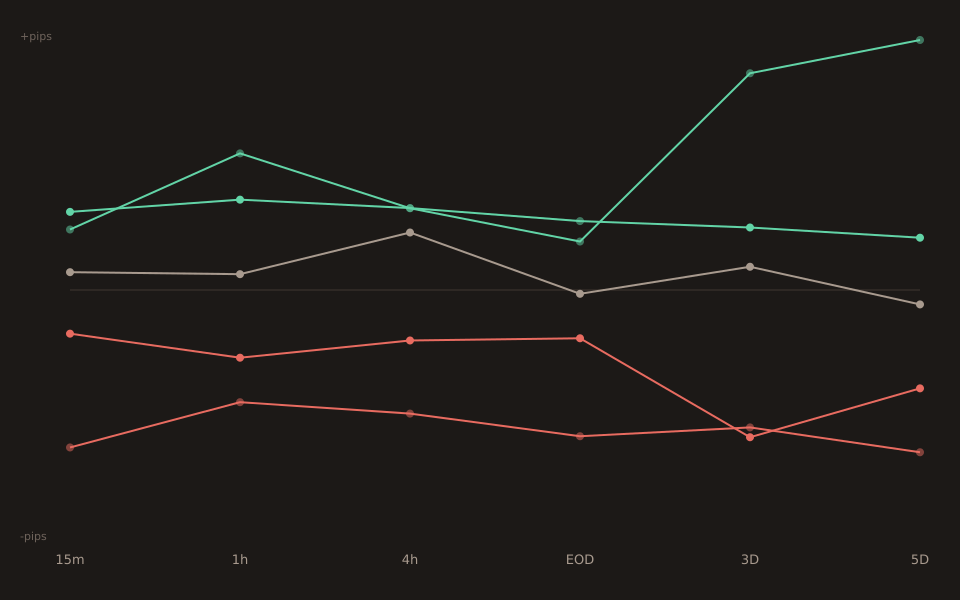
The 15-minute bucket table
| Bucket | n | 15m median | p25 | p75 | Pct up (15m) |
|---|---|---|---|---|---|
| big_miss | 10 | +15.10 | −14.68 | +47.10 | 70% |
| small_miss | 33 | +19.50 | +3.40 | +37.50 | 79% |
| in_line | 68 | +4.45 | −15.10 | +29.10 | 54% |
| small_beat | 59 | −10.90 | −31.15 | +11.10 | 36% |
| big_beat | 26 | −39.30 | −49.80 | −7.23 | 15% |
The pct-up column reads 70 / 79 / 54 / 36 / 15— monotonic through all five buckets. Big_beat lands 22 of 26 prints on the down side; the four upside prints are individually small (median +5.6 pips, biggest is +35.1). One of them is the 2020-05-08 COVID outlier where the actual unemployment rate came in at 13.0% against a 18.0% consensus (a huge statistical “beat” even by pandemic standards) but USDCAD still gained a token +3.5 pips in the first fifteen minutes. Remove that print and big_beat n=25 median stays essentially unchanged at −39.5p.
Why unemployment miss/beat means the opposite of most releases
For most macro releases, “beat” is the trader-friendly side — a GDP beat is good news, a CPI beat is (usually) hawkish, an Employment Change beat means more jobs added. Unemployment is inverted: a beat means unemployment came in LOWER than consensus (fewer people unemployed = better fundamentals), a miss means it came in HIGHER (worse). The tool’s bucket labels stay consistent with “actual > forecast = beat, actual < forecast = miss” — the currency interpretation depends on the release semantics.
Same logic applies to jobless claims, to trimmed CPI when measured against the central-bank target rather than the last print, and to any release where the “good” direction is lower. The Canadian Unemployment Rate is one of the cleanest examples in the release calendar because the print co-arrives with Employment Change, giving traders two independent signals about the health of the same labour market on the same wire — and both signals almost always agree in direction.
Comparison against Employment Change on the same day
The 2026-08-01 CAD Employment Change on USDCAD post found 22 of 23 big-beat prints (96% down-rate) sending USDCAD lower. This Unemployment Rate post finds 22 of 26 big-beat prints (85% down-rate). Both live on the same StatCan wire, both are contrarian “lower is better” readings, both hit USDCAD in the same direction — the Employment Change edge is a shade cleaner because a raw jobs count is a purer signal than a rate whose denominator (the labour force) moves independently on participation dynamics.
If you’re trading a CAD Employment Friday, both cells on the wire (Employment Change AND Unemployment Rate) are pointing at USDCAD in the same direction on most prints. When the two cells disagree — Employment Change up but Unemployment Rate also up (participation-driven), or Employment down but Unemployment steady (a wash) — the price reaction typically follows the raw jobs number. This is the reason most FX desks quote Employment Change as the “headline” and Unemployment Rate as the “confirmer”.
What this doesn’t say
The pct-up numbers describe past prints, not future edge.A 15% up-rate on 26 big-beat samples has a distribution-free 95% CI running roughly from 4% to 34% — the true up-rate is very likely below 34%, but the point estimate is a loose target. Read the finding as “strong down-side bias, wide margin around the exact rate”.
The 4-hour walk is where the edge starts to widen but also to blur.Big_beat at 4h median = −30.85p (n=16); the sample shrinks because recent prints don’t yet have a finished 4-hour candle. In_line at 4h medians +14.35p, slightly out of order relative to the monotonic 15m/30m/1h walk — that’s 4-hour noise, not a broken pattern. If you’re holding past the first hour, the marginal edge past 30 minutes is thinner per-pip than the immediate reaction.
The Sharpe ratio on the big_beat “short USDCAD” strategy is deceptively high. Per-trade Sharpe on the 26-print sample is 0.98 (mean pnl +34.3p, std 35.1p). But today’s Stats for Traders #9 works through the Sortino ratio for the same bucket and gets 4.79 — because 22 of 26 trades won, most losing trades were tiny, and only one loser (2017-08-04 at +35.1p) really counted. The Sharpe-vs-Sortino gap is unusually wide on this signal, which is both a real feature of the pattern AND a red flag: Sortino rewards a highly-asymmetric loss distribution that’s driven by a single big loser, and any signal whose Sortino is driven by n=1 outlier avoidance deserves out-of-sample skepticism.
Open the tool → Free forever. No signup. No email required.