Thursday 12:00 UTC — the BoE decision slot — cracks the top-50 loudest weekday half-hours of 19 of 28 liquid FX pairs (median rank 42), and EURGBP has it at rank 20. Yesterday's Wed 18:00 FOMC slot cracked top-50 for just 1 pair. Same 8-per-year cadence, opposite loudness — neighboring-slot bleed is the mechanism.
Thursday 12:00 UTC — the BoE Bank Rate decision slot, active on 8 of 52 Thursdays a year — ranks 20 to 83 across all 28 liquid FX pairs, out of 237 weekday half-hour cells. 19 of 28 pairs put it in their top-50; EURGBP is the only pair to break top-20 (rank 20/237). Yesterday’s Wednesday 18:00 UTC (FOMC slot, same 8-per-year cadence) cracks top-50 for just 1 of 28 pairs with median rank 108. Same firing frequency, opposite loudness.
Direct sibling to yesterday’s Wed 18:00 UTC FOMC-blank post (2026-09-02). Both slots fire the same 8 times per year on a Thursday/Wednesday. Same ~15% direct density into their respective day-slot cells. But the two slots end up with a 62-position mean rank gap — every one of the 28 pairs ranks the BoE slot louder than the FOMC slot. The mechanism is neighboring-slot bleed: the BoE slot sits 30 min before the US 12:30 UTC macro peak, while the FOMC slot sits in a 5-hour US-afternoon dead zone.
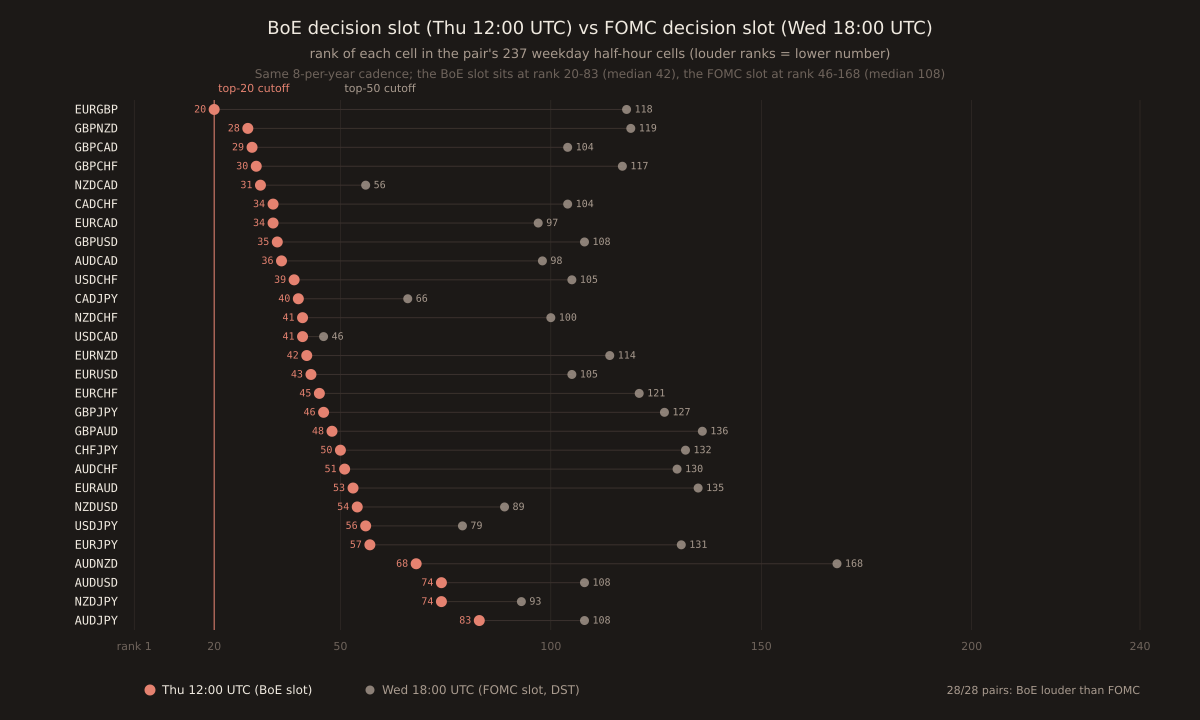
Both slots fire at exactly the same cadence
BoE Bank Rate: 8 MPC decision days per calendar year (typically first Thursday of the month, 12:00 UTC). FOMC: 8 statement release days per year (typically Wednesday afternoons, either 18:00 UTC in DST months or 19:00 UTC in standard-time months). Both slots see an ~8-per-year direct-fire density into ~52 weekday-of-the-year cells (~15% of the direct calendar), and are otherwise diluted by 44 quiet weeks. If loudness were purely a function of firing density, the two slots should rank comparably.
Full rank table — top-20 loudest pairs at BoE slot
| Pair | BoE Thu 12:00 rank | BoE median | FOMC Wed 18:00 rank | FOMC median | rank gap |
|---|---|---|---|---|---|
| EURGBP | 20 | 10.10p | 118 | 6.00p | +98 |
| GBPNZD | 28 | 29.00p | 119 | 21.85p | +91 |
| GBPCAD | 29 | 23.70p | 104 | 17.00p | +75 |
| GBPCHF | 30 | 17.90p | 117 | 11.20p | +87 |
| NZDCAD | 31 | 11.10p | 56 | 9.90p | +25 |
| CADCHF | 34 | 10.60p | 104 | 8.00p | +70 |
| EURCAD | 34 | 18.00p | 97 | 13.80p | +63 |
| GBPUSD | 35 | 17.80p | 108 | 12.80p | +73 |
| AUDCAD | 36 | 10.80p | 98 | 9.00p | +62 |
| USDCHF | 39 | 11.40p | 105 | 8.50p | +66 |
| CADJPY | 40 | 12.60p | 66 | 11.20p | +26 |
| NZDCHF | 41 | 9.40p | 100 | 8.00p | +59 |
| USDCAD | 41 | 12.55p | 46 | 11.70p | +5 |
| EURNZD | 42 | 21.50p | 114 | 18.10p | +72 |
| EURUSD | 43 | 13.35p | 105 | 10.30p | +62 |
| EURCHF | 45 | 8.70p | 121 | 5.80p | +76 |
| GBPJPY | 46 | 22.10p | 127 | 16.50p | +81 |
| GBPAUD | 48 | 23.00p | 136 | 17.00p | +88 |
| CHFJPY | 50 | 15.20p | 132 | 11.00p | +82 |
| AUDCHF | 51 | 9.90p | 130 | 7.90p | +79 |
| EURAUD | 53 | 17.50p | 135 | 14.00p | +82 |
| NZDUSD | 54 | 9.60p | 89 | 8.80p | +35 |
| USDJPY | 56 | 11.30p | 79 | 10.30p | +23 |
| EURJPY | 57 | 16.20p | 131 | 12.40p | +74 |
| AUDNZD | 68 | 9.60p | 168 | 7.90p | +100 |
| AUDUSD | 74 | 9.70p | 108 | 8.80p | +34 |
| NZDJPY | 74 | 11.20p | 93 | 10.50p | +19 |
| AUDJPY | 83 | 11.80p | 108 | 11.00p | +25 |
EURGBP is the sole pair to crack top-20 at the BoE slot — logical, as EURGBP is the purest BoE-vs-ECB relative-policy pair. Six of the seven GBP-crosses concentrate in rank 20-48 (GBPAUD 48 the weakest). Non-GBP pairs join the top-50 through neighboring-slot bleed rather than direct BoE exposure. On the FOMC side, USDCAD is the only pair in top-50 (rank 46) — the USD/CAD relative-rate channel captures FOMC signals through Powell’s cross-border rate-differential impact.
The Thursday morning ramp — why 12:00 UTC gets carried up
On EURGBP, the neighboring-cell ranks show the ramp cleanly:
| Thursday slot (UTC) | EURGBP rank | Median range | Note |
|---|---|---|---|
| 11:00 | 55 | 9.20p | London mid-morning, pre-US baseline |
| 11:30 | 43 | 9.40p | pre-US pressure begins |
| 12:00 | 20 | 10.10p | BoE MPC decision slot ← today's focus |
| 12:30 | 4 | 11.00p | US-morning macro window opens (jobless claims / PPI) |
| 13:00 | 13 | 10.30p | brief post-first-print pause |
| 13:30 | 1 | 11.45p | US NFP / CPI / GDP window — pair's LOUDEST cell |
| 14:00 | 5 | 10.85p | second-tier US macro (10:00 ET) |
| 14:30 | 2 | 11.10p | US-morning second wave (housing / EIA) |
The BoE slot at 12:00 UTC (rank 20) is a way-station on a monotone ramp from rank 55 at 11:00 UTC to rank 1 at 13:30 UTC. If BoE were the primary driver of the 12:00 UTC loudness, rank 20 would be a LOCAL PEAK; instead it’s a mid-point on a US-morning-driven ramp. On the 15% of Thursdays that are BoE-active, the 12:00 UTC cell IS the peak; on the other 85% of Thursdays, the cell dilutes back to the ramp baseline that its neighboring cells define.
Contrast with the FOMC Wed 18:00 UTC dead zone
Wed 18:00 UTC sits in the middle of a 5-hour US-afternoon lull. The nearest earlier macro cell is 14:30 UTC (10:00 ET; ISM, housing) at 3.5 hours before. The nearest later cell is 00:00 UTC Tokyo open at 6 hours after. On EURGBP, Wed 17:00 UTC ranks 111, Wed 17:30 UTC ranks 117, Wed 18:00 UTC ranks 118, Wed 18:30 UTC ranks 124, Wed 19:00 UTC ranks 129 (standard-time FOMC alternate) — a flat trough with no local bump at the FOMC slot itself; the whole neighborhood sits at rank 111-135 (bottom half). Any signal from the 8 FOMC-active Wednesdays dilutes into a fundamentally quiet 5-hour trough. This is why the FOMC-blank finding held despite the same 8-per- year cadence as the BoE.
Cross-links
Direct sibling: yesterday’s Wed 18:00 UTC FOMC blank across all 28 pairs (2026-09-02) established the FOMC baseline that today’s BoE result contrasts. Related family-clustering: the GBP-cross top-5 analysis in GBP-crosses US-morning family (2026-08-31) showed all 7 GBP-crosses concentrate their top-5 in Tue-Fri 12:30-14:30 UTC — the same US-morning window whose ramp today’s BoE slot sits on. Today’s slot-1 pair, GBPCHF, joins the family with the US-morning ramp confirming its high-loudness rank of 30 at Thu 12:00 UTC.
Verification note
All 28 pairs’ Calm Zones scan data pulled fresh on 2026-09-03 from https://tryvantage.co/api/v1/calm-zones/scan?pair=<PAIR>. Ranks computed on the weekday-cell subset (dow < 5, 237 cells per pair) by sorting descending on median_range_pips with None-valued cells filtered out. Data coverage: 755 observation days per pair (2020-05 through 2026-08). Both slot ranks cross-verified against the pair’s scan JSON. Chart via one-off script reusing scripts/insights-charts/svg.ts and theme.ts primitives with sharp rasterization.