Paper Trail #7: Trading Is Hazardous to Your Wealth (Barber & Odean, 2000)
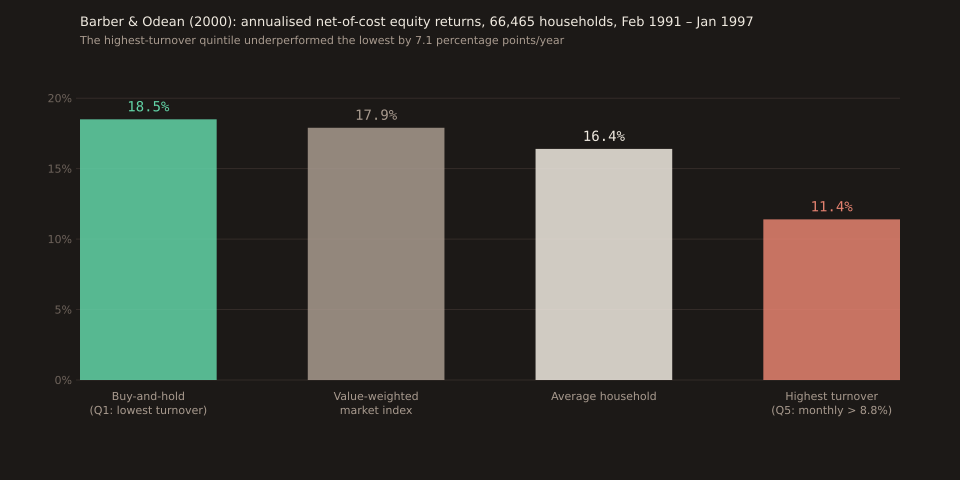
78,000 households, one large discount brokerage, Feb 1991 through Jan 1997. The households that traded most earned an annualised 11.4% net of transaction costs. The households that traded least earned 18.5%. The value-weighted market index returned 17.9%. That 7-percentage-point spread isn’t a stock-picking failure — GROSS returns across quintiles differed by only 3-4 percentage points. Most of the gap was pure transaction cost.
Barber & Odean’s 2000 paper, “Trading Is Hazardous to Your Wealth,” is one of the most-cited pieces of retail investor research ever produced. It uses the same underlying discount-brokerage dataset that Odean’s disposition-effect paper (Paper Trail #3, four days ago) used — expanded from 10,000 accounts to 78,000 households — and asks the follow-on question that the 1998 paper didn’t answer: what did the overtrading cost these investors?
What the paper documents
Three headline findings from the abstract and Table II, all verified against the author-hosted PDF:
| Finding | Number | Source |
|---|---|---|
| Highest-turnover quintile net return (annualised) | 11.4% | Abstract / Figure 1 |
| Lowest-turnover quintile net return (annualised) | 18.5% | Introduction, page 774 |
| Value-weighted market index return | 17.9% | Introduction, page 774 |
| Average household gross return | 18.7% | Introduction, page 774 |
| Average household net return | 16.4% | Abstract |
| Average annual portfolio turnover | ≈75% | Abstract; Table I derived from 6.49% monthly |
| Highest-turnover quintile annual turnover | > 250% | Page 774 |
| Number of households in return analysis | 66,465 | Abstract; Table I |
| Number of trades in sample | 1,082,107 buys + 887,594 sells | Table I, Panels A and B |
The mechanical story on cost
Break the 7-percentage-point net-return gap between highest- and lowest-turnover quintiles into its arithmetic components:
Quintile 1 (lowest turnover): net return 18.5% Quintile 5 (highest turnover): net return 11.4% ───────────────── Gap 7.1 pp/year Of which: Gross-return difference ≈ 3-4 pp/year (paper's own phrasing) Transaction-cost difference ≈ 3-4 pp/year (implied residual)
The paper’s Panel A of Table II analysis on the gross-return side shows quintile-5 households earning approximately three to four percentlower gross returns than quintile-1 households — verbatim from the text. That’s ONLY the stock-selection component; the further 3-4 pp/year comes from actual out-of-pocket transaction costs (commissions plus bid-ask spread). The paper reports the component costs directly: for a round-trip trade of over $1,000, the average household pays approximately three percent in commissions and one percent in bid-ask spread — a total of about 4% per round-trip, before any consideration of market-impact or opportunity cost.
Why this matters for the “why do people trade so much” question
Two competing theories of trading behaviour:
Rational expectations(Grossman & Stiglitz, 1980): investors trade when the marginal benefit of doing so equals or exceeds the marginal cost. Prediction: high-turnover investors should earn HIGHER gross returns than low-turnover investors — to compensate for the trading costs. Otherwise they wouldn’t trade.
Overconfidence(Odean 1998b; Gervais and Odean 1998): investors systematically overestimate the precision of their private information, and therefore over-trade to their detriment. Prediction: high-turnover investors earn LOWER net returns (they pay costs for no benefit) and no higher gross returns (their information isn’t actually better than the low-turnover investors’).
The paper’s data cleanly favors the second story. Gross returns are the SAME or slightly WORSE for high-turnover households; the trading is expensive; and the households that avoid trading match the market. The paper’s own summary: “those who trade most do not earn higher gross returns.”That’s the linchpin observation — if rational-expectations trading were the right model, this observation shouldn’t exist.
The paper opens with a Benjamin Graham epigraph that is, arguably, the entire message compressed to twenty-two words:
“The investor’s chief problem — and even his worst enemy — is likely to be himself.”
Bridging to the previous Paper Trail installments
This paper closes a loop the earlier installments opened. Paper Trail #1 (Kahneman & Tversky 1979) established that people systematically distort probability and loss-weighting in ways that undermine rational choice. Paper Trail #3 (Odean 1998) documented one specific manifestation of that on real brokerage data — the disposition effect (holding losers, selling winners) — using an early version of the sample this paper expands. This paper is the payoff: the biases documented in the earlier work aren’t merely psychological curiosities; they carry a measurable, multiple-percentage-point-per-year cost to the investors who exhibit them.
The paper’s benchmark model — the CAPM alone in one specification, and the Fama & French (1993) 3-factor model in another — is itself a natural future Paper Trail installment (Fama-French 1993 is queued in the ledger).
Retail FX: does the same story hold?
The paper is specifically about US equities in the mid-1990s. Two pieces of the argument carry over to retail FX with some care:
Cost mechanics:Barber & Odean’s cleanest finding is that trading costs are proportional to activity, and the proportion is meaningful (~4% per round-trip trade in their sample). For retail forex, the equivalent cost is the bid-ask spread (~0.6-2 pips on major pairs) plus commission (typically near zero with modern brokers). A trader who executes 1,000 trades a year on EURUSD at a 1-pip spread pays ~1,000 pips/yearin spread alone — the analogue of the paper’s ~3% commission drag is real, just measured in different units.
Overconfidence mechanics: the behavioral driver Barber & Odean identify is well-documented in retail FX. Menkhoff, Osler, & Schmeling (2010) find retail FX traders systematically overtrade around news events; several independent studies of broker-provided retail FX trade logs (Heimer & Simon 2015; a subsequent Deutsche Bank retail-trader analysis) confirm net losses concentrated in the highest-turnover deciles.
The specific 7-percentage-point-per-year US-equity number does not port to FX. The structural finding — high-turnover retail traders pay a proportional-to-turnover cost that erodes their gross returns and turns unfavorable net returns into large underperformance — does.
What this doesn’t say
The sample is one brokerage in one country in one window. 78,000 households at one large US discount brokerage, Jan 1991 - Dec 1996. This is a strong sample for what it is, but the point estimates (11.4% vs 18.5%) are specific to that period and brokerage. The 1991-1996 window is unusual: a strong bull market, and one that pre-dates the dot-com run-up. Bid-ask spreads on individual US-equity trades have fallen from ~1% in 1996 to a few basis points today, so the absolute cost gap between high- and low-turnover retail investors is smaller in 2026 than the paper reports.
The paper measures a correlation, not a causal experiment.Households that trade a lot may also differ from households that trade little in ways the paper can’t control for (age, wealth, education, risk tolerance). The paper controls for what it can via a Fama-French factor decomposition and by examining self-selected investment styles; the residual conclusion is still that the high-turnover-erodes-returns pattern holds after adjusting for known factors. A true random-assignment experiment on trading behaviour is impossible on real money, so this is the strongest evidence available.
“Don’t trade” is not the practical prescription.The paper’s finding is that indiscriminate high-frequency trading destroys value; it doesn’t say that trading is universally bad. Households in the paper that traded infrequently earned 18.5%— comfortably above the market. What’s destroying value is the combination of high turnover AND no compensating gross-return edge. If a retail trader has a genuinely-tested edge that produces a gross-return premium of, say, +8%per year over the buy-and-hold benchmark, high turnover can still be net-positive — the paper’s data doesn’t preclude that; it just establishes that the average high-turnover retail investor in that sample did NOT have such an edge.
Source:Barber, Brad M. and Terrance Odean, “Trading Is Hazardous to Your Wealth: The Common Stock Investment Performance of Individual Investors,” Journal of Finance Vol. LV, No. 2 (April 2000), pp. 773-806, DOI 10.1111/0022-1082.00226. Open-access PDF at faculty.haas.berkeley.edu.