Swiss CPI m/m on EURCHF: 199 releases with a monotonic median walk but a beat-side pct-up inversion — big_beat is up 36.4% of the time, small_beat only 20.9%
199 non-contaminated Swiss CPI m/m releases on EURCHF, 15-minute window. Medians walk +12.50 / +2.95 / −0.10 / −2.10 / −2.90 pips big_miss → big_beat — monotonic across every bucket boundary. Pct-up walks 83.3 / 71.7 / 47.8 / 20.9 / 36.4 percent — miss-side monotonic, but small_beat 20.9% up is BELOW big_beat 36.4% up. Bigger beats send EURCHF down LESS reliably than smaller beats do.
Nine days ago I published Swiss CPI on USDCHF as the clean 5-bucket directional post — monotonic median walk, monotonic pct-up walk, no surprises. Today’s pair is the EUR cross rather than the USD cross. The miss side gets bigger on EURCHF (big_miss median +12.50p vs +6.65p on USDCHF, nearly double) but the beat side breaks in an unusual way. This post is about that break.
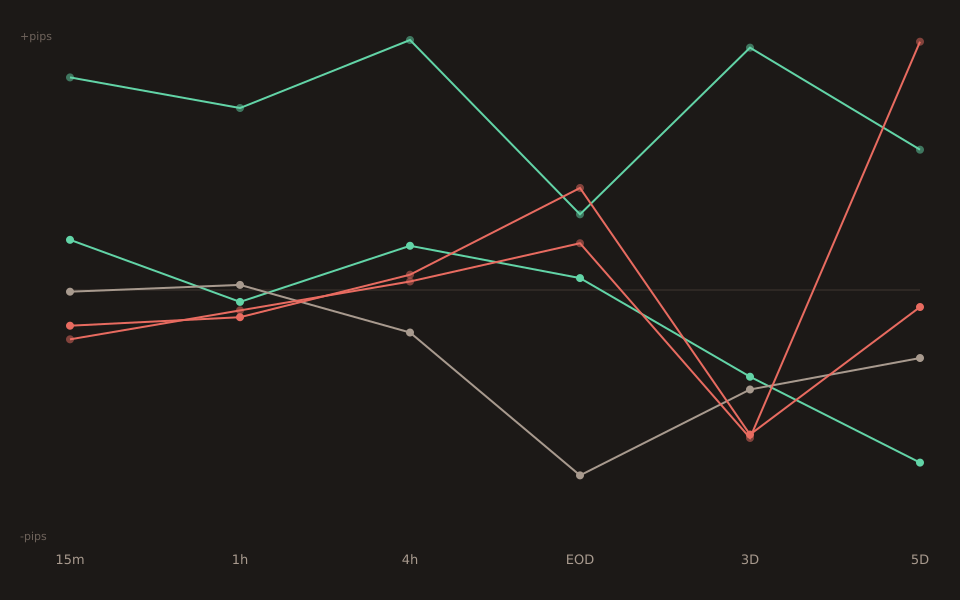
The 15-minute bucket table
| Bucket | n | 15m median | p25 | p75 | Pct up (15m) |
|---|---|---|---|---|---|
| big_miss | 18 | +12.50 | +0.73 | +31.13 | 83.3% |
| small_miss | 60 | +2.95 | −0.13 | +8.03 | 71.7% |
| in_line | 67 | −0.10 | −3.95 | +3.75 | 47.8% |
| small_beat | 43 | −2.10 | −6.40 | −0.15 | 20.9% |
| big_beat | 11 | −2.90 | −12.20 | +2.25 | 36.4% |
Medians walk clean: +12.50 → +2.95 → −0.10 → −2.10 → −2.90. Every bucket boundary respects direction and magnitude order. Pct-up: 83.3 → 71.7 → 47.8 → 20.9 → 36.4 — miss side monotonic and in_line lands almost exactly at 50% as expected, but the small_beat → big_beat step goes the wrong way. Look at the p25/p75 columns to see why: small_beat’s IQR is [−6.40, −0.15] — a tight, firmly negative band. Big_beat’s is [−12.20, +2.25] — much wider and straddling zero. Big_beat isn’t a “bigger version of small_beat”; it’s a mixed-outcome bucket with a wider tail.
Head-to-head with USDCHF: nine-day sibling comparison
| Bucket | EURCHF med | USDCHF med | EURCHF pct up | USDCHF pct up |
|---|---|---|---|---|
| big_miss | +12.50 | +6.65 | 83.3% | 77.8% |
| small_miss | +2.95 | +3.15 | 71.7% | 63.3% |
| in_line | −0.10 | +0.30 | 47.8% | 52.2% |
| small_beat | −2.10 | −1.50 | 20.9% | 37.2% |
| big_beat | −2.90 | −4.50 | 36.4% | 36.4% |
Two things jump out. First, EURCHF’s miss-side amplitudes are roughly double USDCHF’s (big_miss +12.50 vs +6.65, small_miss +2.95 vs +3.15 — the small-miss magnitudes are similar but the tail miss is much bigger on EURCHF). A CHF-strengthening surprise pushes EUR down harder than USD. Second, on big_beat the medians are the reverse: USDCHF −4.50p is bigger in magnitude than EURCHF −2.90p. The two pairs share the exact same big_beat up-rate (36.4%), so the direction is identical — the size just isn’t. EURCHF’s big_beat bucket is where the EUR-cross story stops being a cleaner version of the USD-cross story.
The 18 big-miss and 11 big-beat prints, individually
With n=18 and n=11 the whole tails are listable. Miss side (long the surprise = long EURCHF) — 15 of 18 sent EURCHF up at 15 minutes:
2010-07-06 actual=-0.4 cons=+0.1 z=-2.99 +66.0p 2011-05-10 actual=+0.1 cons=+0.5 z=-1.67 +74.0p ← max 2012-12-06 actual=-0.3 cons=+0.0 z=-2.19 +11.8p 2015-03-06 actual=-0.3 cons=+0.0 z=-1.96 +10.7p 2015-05-08 actual=-0.2 cons=+0.1 z=-1.96 +19.5p 2018-12-04 actual=-0.3 cons=-0.1 z=-1.94 +1.4p 2019-10-02 actual=-0.1 cons=+0.1 z=-2.07 +2.7p 2019-11-01 actual=-0.2 cons=+0.0 z=-1.86 -0.6p ← counter 2020-05-05 actual=-0.4 cons=-0.1 z=-2.84 -1.0p ← counter (COVID) 2021-03-03 actual=+0.2 cons=+0.4 z=-1.61 +0.2p 2021-10-04 actual=+0.0 cons=+0.2 z=-2.25 +0.5p 2022-10-03 actual=-0.2 cons=+0.1 z=-1.86 +18.0p 2023-12-04 actual=-0.2 cons=+0.0 z=-1.73 +35.0p 2024-02-13 actual=+0.2 cons=+0.6 z=-3.07 +44.2p 2024-04-04 actual=+0.0 cons=+0.3 z=-2.05 +42.6p 2025-05-05 actual=+0.0 cons=+0.2 z=-1.90 +17.8p 2025-11-03 actual=-0.3 cons=-0.1 z=-1.85 +13.2p 2026-04-02 actual=+0.2 cons=+0.5 z=-2.44 -1.1p ← counter
Beat side (short EURCHF) — 7 of 11 sent EURCHF down at 15 minutes:
2011-04-06 actual=+0.6 cons=+0.2 z=+2.07 -79.0p ← pre-SNB-floor era, min 2013-03-08 actual=+0.3 cons=-0.3 z=+4.57 -7.3p 2016-03-08 actual=+0.2 cons=-0.1 z=+1.86 -17.1p 2017-03-08 actual=+0.5 cons=+0.2 z=+2.47 +3.2p ← counter 2017-06-08 actual=+0.2 cons=+0.0 z=+1.68 +1.3p ← counter 2018-04-05 actual=+0.4 cons=+0.2 z=+2.40 -3.6p 2020-08-03 actual=-0.2 cons=-0.4 z=+1.65 +5.6p ← counter 2022-02-11 actual=+0.2 cons=+0.0 z=+1.79 -0.3p 2022-03-03 actual=+0.7 cons=+0.3 z=+3.23 -2.9p 2022-06-02 actual=+0.7 cons=+0.3 z=+2.67 -40.2p 2025-08-04 actual=+0.0 cons=-0.2 z=+2.01 +5.1p ← counter
The 2011-04-06 big-miss-in-mirror-image print at −79.0p comes from the pre-SNB-floor era; EURCHF was drifting toward the 1.20 floor the SNB would install five months later on September 6, 2011. It’s not marked contaminated by the tool’s baseline check, but it’s a regime that no longer exists. The four beat-side counter-prints are 2017-03/06 (mid-floor era), 2020-08 (post-floor COVID) and 2025-08 — a scattered set with no obvious grouping. The three miss-side counters are 2019-11, 2020-05 (COVID), and 2026-04 (a small negative just this April). Nothing in the tails looks systematically broken; the beat-side dispersion is genuinely wider than the miss-side, which is what drives the pct-up inversion.
Why the beat side inverts: it’s a 15-minute-window artifact
The pct-up walk across windows tells you when the inversion is present and when it disappears:
| Window | big_miss | small_miss | in_line | small_beat | big_beat |
|---|---|---|---|---|---|
| 1m | 88.9 | 73.3 | 57.4 | 27.9 | 45.5 |
| 5m | 83.3 | 71.7 | 50.0 | 39.5 | 36.4 |
| 15m | 83.3 | 71.7 | 47.8 | 20.9 | 36.4 |
| 30m | 77.8 | 70.2 | 55.2 | 38.1 | 27.3 |
| 1h | 86.7 | 41.2 | 52.5 | 36.8 | 44.4 |
| 4h | 73.3 | 58.8 | 32.7 | 51.9 | 57.1 |
At 1m and 15m the beat side inverts. At 30m the whole walk is fully monotonic descending — 77.8 / 70.2 / 55.2 / 38.1 / 27.3. So “the beat side reverses at 15m and normalises by 30m” is the specific claim. Read against the 4h row, the beat side has flipped sign entirely (big_beat median walk goes back up, pct-up walk goes above 50% on both beat buckets) — by four hours the Swiss surprise-response has been absorbed by the EU-session flow.
What this doesn’t say
The beat-side tails aren’t tight. Per Stats for Traders #3, with n=11 (big_beat) the distribution-free 95% CI for the true up-rate is roughly 11%–70% around 36.4%. With n=43 (small_beat) the CI for 20.9% is roughly 10%–36%. The CIs overlap, so the inversion isn’t statistically ironclad. What’s more convincing than the raw percentages is the p25/p75 dispersion difference (big_beat IQR 14.5p wide, small_beat IQR 6.3p wide — big_beat is genuinely a wider-tailed bucket).
The 2011-04-06 −79p print carries weight in a small bucket. Drop it and big_beat becomes n=10 with median −2.75p (near-unchanged), pct_up 40.0% — the inversion narrows but still exists (small_beat 20.9%, big_beat 40.0%). Drop the +5.1 counter-print from 2025-08-04 as well and pct_up drops to 33.3%. The story survives sensitivity checks, but the magnitudes shift meaningfully.
EURCHF is a quiet pair. Per the quietest-major ranking EURCHF isn’t as quiet as EURGBP but it’s tighter than the USD-crosses. A +12.5p big-miss median is a genuinely large move for this pair — it’s not just a small percentage change. Scale expectations to the pair’s baseline, not to a EURUSD-sized surprise response.
Open the tool → Free forever. No signup. No email required.