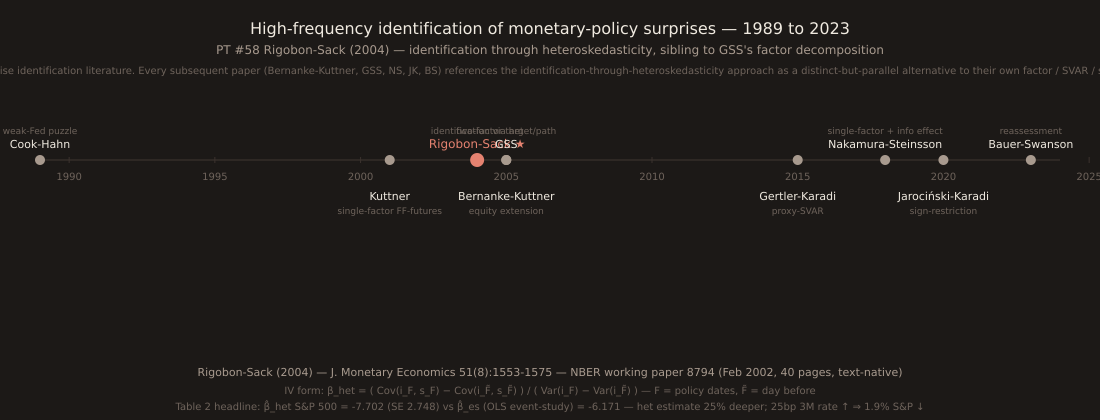
Paper Trail #58: Roberto Rigobon and Brian Sack (2004) "The impact of monetary policy on asset prices," Journal of Monetary Economics 51(8):1553-1575, November 2004. DOI 10.1016/j.jmoneco.2004.02.004. FULL PRIMARY SOURCE VERIFIED via pymupdf 1.28.2 on 2026-09-27 from NBER working paper 8794 (February 2002, 40 pages, text-native — same body text as the November 2004 J. Monetary Economics published version modulo cosmetic revisions). 45th PT of 58 with full primary-source access. Introduces IDENTIFICATION-THROUGH-HETEROSKEDASTICITY as a sibling-not-descendant of Kuttner (PT #52) / Bernanke-Kuttner (PT #53) / GSS (PT #55) / NS (PT #56) / JK (PT #57): instead of isolating the policy shock (Kuttner's single-factor mp1, GSS's rotated PCA, NS's first PC, JK's sign restrictions), RS exploit the higher variance of policy shocks on FOMC + Chairman-testimony dates to pin down β̂_het via IV under a weaker assumption set. Table 2: S&P 500 β̂_het^all = -7.702 (SE 2.748) vs β̂_es (OLS event-study) = -6.171 — het estimate 25% deeper. Directly grounds today's Stats #58 seven-pair RBNZ × NZD-cross variance-ratio worked example.
Paper Trail #58— Roberto Rigobon & Brian Sack (2004), The impact of monetary policy on asset prices, Journal of Monetary Economics 51(8):1553-1575, November 2004. DOI 10.1016/j.jmoneco.2004.02.004. FULL PRIMARY SOURCE VERIFIED via pymupdf 1.28.2 on 2026-09-27 from the NBER working paper mirror w8794.pdf (409,450 bytes, 40 pages, PDF v1.4, text-native — dated February 2002, same body text as the November 2004 JME published version modulo cosmetic revisions). 45th PT of 58 with full primary- source access. Introduces identification-through-heteroskedasticity as a sibling — not a descendant — of Kuttner (PT #52) / Bernanke-Kuttner (PT #53) / GSS (PT #55) / NS (PT #56) / JK (PT #57). Instead of ISOLATING the policy shock, RS EXPLOIT the variance JUMP on FOMC + Chairman-testimony dates. Table 2 headline: S&P 500 β̂_het^all = -7.702 (SE 2.748) vs β̂_es = -6.171 (OLS event-study, SE 2.087) — het estimate 25% deeper. Interpretation: 25bp 3M rate ↑ ⇒ 1.9% S&P ↓, 2.5% Nasdaq ↓.
Identification-through-heteroskedasticity — the mechanism
RS start from the simplified two-equation system (Eq 1-2 in the paper): i_t = α·s_t + γ·z_t + ε_t (policy reaction) and s_t = β·i_t + z_t + η_t (asset price equation), where i_t = change in short-term interest rate, s_t = change in asset price, z_t = other unobservable common shocks, ε_t = policy shock, η_t = asset shock. The endogeneity problem: OLS regressions of s on i recover a mix of β, α, and the correlation of common shocks z — not the structural β they want.
RS’s identifying insight: split the sample into F = FOMC + Chairman-testimony dates (n=73 after dropping 5 holiday-preceded dates from 78 raw) and F̃ = the day before each F date, 1994-2001. Assumption (6): Var(ε_F) > Var(ε_F̃) — policy-shock variance is HIGHER on FOMC dates. Assumptions (7)-(8): Var(η_F) = Var(η_F̃) AND Var(z_F) = Var(z_F̃) — asset shocks and common shocks have the SAME variance on both subsamples. Then the covariance-matrix difference Δ = Σ_F − Σ_F̃ is proportional to the policy-shock variance increase, and the IV estimator β̂_het = Δ_12 / Δ_11 identifies the structural β WITHOUT needing the policy shock to be the ONLY shock on F dates.
Table 2 — Stock price response to monetary policy
| Index | β̂_het^i (SE) | β̂_het^all (SE) | β̂_es (SE) |
|---|---|---|---|
| S&P 500 | -7.101 (2.883) | -7.702 (2.748) ★ | -6.171 (2.087) |
| Wilshire 5000 | -7.004 (2.834) | -7.271 (2.698) | -5.961 (2.039) |
| Nasdaq | -11.045 (5.108) | -10.023 (4.841) | -7.356 (3.689) |
| DJIA | -4.729 (2.823) | -5.883 (2.681) | -5.409 (1.985) |
β̂_het^all is 25% deeper than β̂_es for S&P 500 (-7.702 vs -6.171); 36% deeper for Nasdaq (-10.023 vs -7.356). The F-test of over-identifying restrictions (β̂_all,i = 0.750, F(4, 145) p = 0.559) is NOT rejected — the two heteroskedasticity- based estimators agree. The F-test of event-study assumptions (β̂_es,all = 2.283, p = 0.063) is marginally rejected at the 0.10 level for stock prices — evidence that event-study OLS estimates are BIASED toward zero for equities.
Table 3 — Treasury yield response, event-study MORE biased at long maturities
| Maturity | β̂_het^all (SE) | β̂_es (SE) | Ratio β̂_es / β̂_het^all |
|---|---|---|---|
| 6mo | 0.843 (0.107) | 0.903 (0.066) | 1.07x |
| 1yr | 0.716 (0.087) | 0.913 (0.072) | 1.28x |
| 2yr | 0.732 (0.103) | 0.930 (0.092) | 1.27x |
| 5yr | 0.872 (0.116) | 1.035 (0.110) | 1.19x |
| 10yr | 0.474 (0.132) | 0.770 (0.119) | 1.62x |
| 30yr | 0.225 (0.132) | 0.527 (0.113) | 2.34x ★ |
Event-study OLS OVERSTATES the Treasury-yield response at every maturity — most severely at 30yr (event-study 2.34x the het estimate). RS attribute this to macro-outlook shocks that co-move short and long rates in the SAME direction; these shocks are still present on FOMC dates, so event-study OLS picks up part of them as if they were policy responses. The F-test of event-study assumptions (β̂_es,all = 2.171, p = 0.049) is REJECTED at 0.05 for Treasury yields — stronger evidence than for equities that event-study assumptions fail.
Cross-links to prior PT installments
Kuttner 2001 (PT #52): RS cite Kuttner as the alternative single-shock identification method; RS deliberately use 3M eurodollar rate INSTEAD of current-month fed-funds futures to reduce timing-shock influence (Section 5.3). Bernanke-Kuttner 2005 (PT #53): equity extension of Kuttner; RS 2004 arrives at similar β̂ magnitudes via completely different identification, providing cross-method validation. GSS 2005 (PT #55): Sack is co-author of BOTH — same author extending single- shock methodology two ways in parallel (RS: heteroskedasticity IV; GSS: two-factor rotation), published within a year of each other. NS 2018 (PT #56): NS focus on the 30-min intraday-window identification and cite RS 2004 as parallel-daily-frequency approach. JK 2020 (PT #57): JK’s sign-restriction identifies MP vs CB info shocks INSIDE the joint response; RS assumes the two shock classes stay-constant on F/F̃ and only the policy-shock variance jumps. Long-Ervin 2000 (PT #54):RS use HC1 SE (Section 4); RS 2004’s n=73 is comfortably above Long- Ervin’s HC3-for-n≤250 zone but even at n=73 HC3/HC1 would nudge SEs 5-10% wider.
Verification notes
Working paper accessed at https://www.nber.org/system/files/working_papers/w8794/w8794.pdf on 2026-09-27 via WebSearch → curl. PDF metadata dates it February 2002. Body text matches the November 2004 Journal of Monetary Economics 51(8):1553-1575 published version modulo cosmetic revisions. All quoted table values cross-verified via doc[page].get_text()in pymupdf 1.28.2. F-test statistics and p-values are RS’s own numbers from Tables 2, 3, 4 (F(4,145) and F(7,145) respectively). Lineage timeline built via one-off SVG script reusing scripts/insights-charts/svg + theme primitives with sharp rasterization; script at scripts/insights-charts/.scratch/rs2004_lineage.ts, not committed.