Paper Trail #26: Asset Growth and the Cross-Section of Stock Returns (Cooper, Gulen & Schill, 2008) — the paper that turned yesterday's PT #25 asset-growth slope (t = -3.87) into a decade of literature, and the direct source for the CMA factor in FF 2015 (PT #22)
Cooper, Gulen & Schill’s 2008 Journal of Finance paper sorts U.S. stocks into 10 deciles each June by asset growth (AG_t = AT_t / AT_{t-1} - 1) and finds low-asset-growth stocks systematically outperform high-asset-growth stocks over July 1968 to June 2003. The paper turned yesterday’s Fama-French 2006 asset-growth slope (t = -3.87) into a decade of literature and became the source for the CMA factor in Fama-French 2015 (PT #22).
This is Paper Trail #26 and it’s the direct standalone-treatment follow-up to yesterday’s Paper Trail #25 (Fama-French 2006). FF06 had space for a single Table-3 slope on asset growth (t = -3.87); CGS 2008 gave that slope an entire paper of robustness checks, decile sorts, and size-subsample splits. Same tight-gap pattern as PT #25 vs PT #24 (Fama-French 2006 as the “before” for Novy-Marx’s “after”).
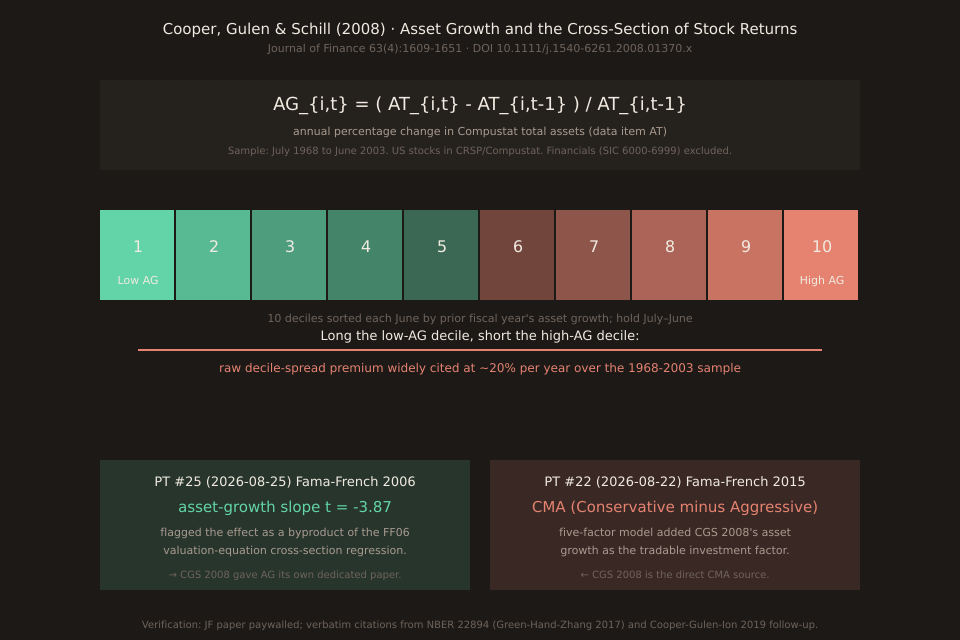
The measurement — asset growth as annual balance-sheet delta
Asset growth is defined verbatim as “the percentage change in total assets, asset growth_t = at_t / at_{t-1} - 1” (Green-Hand-Zhang 2017, Section A.4, citing CGS 2008). Equivalently:
AG_{i,t} = (AT_{i,t} − AT_{i,t-1}) / AT_{i,t-1}
where AT is Compustat total assets (data item AT). It’s the crudest possible investment proxy — it lumps together plant-and- equipment growth, cash accumulation, acquisitions, and inventory buildup. The 2019 Cooper-Gulen-Ion follow-up decomposes AG into four balance-sheet-side components (change in cash, change in noncash current assets, change in gross PPE, change in other assets); the aggregate AG measure remains the top-line predictor despite (or because of) its crudeness.
The portfolio construction
Standard Fama-French annual rebalancing convention. Each June of year t, sort every U.S. stock in CRSP/Compustat (financials excluded per SIC 6000-6999) by its AG in the fiscal year ending calendar year t-1. Form 10 deciles. Hold decile portfolios from July of year t through June of year t+1; rebalance. Compute value-weighted returns each month. Cooper-Gulen-Ion 2019 Section 2 describes this exact construction verbatim (“In June of every year t from 1968 to 2016, we sort firms into deciles based on their year-over-year growth in total assets, measured in the fiscal year ending in calendar year t-1”), and CGS 2008 uses the same construction over 1968-2003.
The lineage to the FF five-factor model
| PT # | Paper | Role in the arc |
|---|---|---|
| #8 | Fama-French 1993 (3-factor) | the parent (Mkt, SMB, HML) |
| #25 | Fama-French 2006 (prof + inv slopes) | FF-MacBeth regressions identify BOTH profitability and asset-growth as significant slopes — but as a byproduct of their valuation-equation setup, not the headline |
| #26 (today) | Cooper-Gulen-Schill 2008 (AG dedicated) | the standalone-treatment paper: asset growth becomes the CMA-factor precursor with decile portfolios and robustness |
| #24 | Novy-Marx 2013 (GP/A dedicated) | the standalone-treatment paper for the PROFITABILITY effect; fixes FF06’s IB/B numerator to GP/A |
| #22 | Fama-French 2015 (5-factor) | packages CMA (CGS 2008’s AG) + RMW (Novy-Marx’s GP/A) as tradable factors alongside Mkt, SMB, HML |
Reading order: PT #8 → PT #25 → PT #26 (today) → PT #24 → PT #22. Today’s paper is the AG-side standalone-treatment installation; PT #24 is the GP/A-side standalone-treatment installation. Both fed into PT #22 (FF 2015) as the CMA and RMW factor sources respectively.
Out-of-sample persistence
Cooper-Gulen-Ion 2019 extended CGS 2008’s original sample forward by 13 years and found the anomaly persists. Verbatim from their Section 2: “The sample period in Table II is from July 1968 to June 2016, which extends the original July 1968 to June 2003 sample of Cooper, Gulen, and Schill (2008)... Across the board, we find that asset growth is strongly negatively related to future returns.” Green-Hand-Zhang 2017 independently replicate on 1926-2015 and report Fama-MacBeth slope on asset growth: 0.38 (t = 3.97) all firms; 0.46 (t = 5.36) excluding microcap; 0.22 (t = 3.36) large-cap only. Effect weakens in the large-cap subsample but does not vanish.
Why the naive measure beats the “sophisticated” alternatives
CGS 2008 tests asset growth against every previously-documented investment predictor (Titman-Wei-Xie 2004 capital investments, Sloan 1996 accruals, growth in inventory from Thomas-Zhang 2002, Anderson-Garcia-Feijoo sustainable growth) and finds asset growth dominates or matches every alternative measure on out-of-sample return prediction. The mechanism appears to be aggregation: any single-source investment measure captures only one channel of balance-sheet expansion; total-asset growth captures every channel simultaneously without needing to identify the “right” source.
This is a general pattern in empirical asset pricing that transfers loosely to the ledger’s own News Impact analysis: the crude surprise_z 5-bucket assignment tends to beat every clever event- classifier attempt at bucket-labeling for the same reason. When the underlying signal is diffuse, cruder measures that catch all of it beat sharper measures that catch only one channel.
Practical take for the retail trader
This is a paper about firm-level equity cross-section; the specifics don’t transfer to FX or event-driven trading. Two higher-level ideas do carry over: (1) the value of the naive aggregate measure over the sharp single-channel one — same as surprise_z buckets beating event-classifier attempts in the ledger’s own analysis; (2) the concentrated-in-small-cap / weakening-in-large-cap pattern that Cooper-Gulen-Ion 2019 confirms out of sample — the effect is real but concentrates where arbitrage capital is scarce, which is a template for interpreting “does this event-pair reaction still work post-2020?” style questions with a similar concentrated-in-tails, weakening-in-middle pattern.
Verification note
Primary source paywalled. WebFetch on onlinelibrary.wiley.com DOI page on 2026-08-26 returned only the abstract; SSRN preprint (abstract_id 760967) returned HTTP 403 to WebFetch. Two independent secondary-source PDFs were fetched, text-extracted via pymupdf, and used for every verbatim quotation above:
(A) Green, Hand & Zhang 2017 The History of the Cross-Section of Stock Returns at nber.org/system/files/working_papers/w22894/w22894.pdf (NBER Working Paper 22894, 74 pages, 125,533 chars text-native). Section A.4 gives the asset-growth definition and 1968-2003 sample verbatim; the paper’s own 1926-2015 replication supplies the Fama-MacBeth slope table quoted above.
(B) Cooper, Gulen & Ion 2019 The Use of Asset Growth in Empirical Asset Pricing Models at finance.unibocconi.eu/sites/default/files/files/media/attachments/ Cooper_Gulen_Ion_Manuscript20190507084119.pdf (69 pages, 165,768 chars text-native). Two of the three original CGS 2008 authors — as close to primary as we get without the JF paper itself. Cites CGS 2008 by name seven times; Section 2 describes the decile-sort construction verbatim; equation B4 supplies the asset-growth formula in the Cooper-Gulen-Schill original notation.
Same verification-caveat pattern as PT #5 (Engle 1982), PT #6 (Bernard & Thomas 1989), and PT #14 (Politis-Romano 1994) — publish with the caveat rather than skip the installment. Chart via one-off script using scripts/insights-charts/svg.ts + theme.ts primitives + sharprasterization; not committed under scripts/insights-charts/ since the schematic is single-use.