Paper Trail #12: Conditional Heteroskedasticity in Asset Returns — A New Approach (Nelson, 1991) — the paper that added the leverage effect to GARCH and gave us EGARCH
Two days ago I covered Bollerslev’s 1986 GARCH paper. Today: the paper that fixed GARCH’s three biggest flaws. Daniel B. Nelson (1991), “Conditional Heteroskedasticity in Asset Returns: A New Approach”. Econometrica 59(2): 347-370. On CRSP daily returns 1962-1987 (n=6408), Nelson estimated an asymmetric log-variance model with θ = −0.118 (SE 0.008) — negative shocks affect conditional volatility 7.2× as stronglyas positive shocks of the same magnitude. That’s the leverage effect Fischer Black identified in 1976 that vanilla GARCH couldn’t capture.
Nelson lists three specific problems with GARCH in his introduction (page 348-350). Vanilla GARCH: (1) assumes volatility responds only to the MAGNITUDE of past shocks, not their sign, contradicting Black’s (1976) leverage effect; (2) requires nonnegativity constraints on all coefficients to keep σ² positive, which are often violated by fitted MLEs; (3) has a fuzzy notion of shock persistence. EGARCH fixes all three: it models ln(σ²) directly with an ARMA-style specification (no positivity constraint), it defines an asymmetric innovation function g(z) (sign matters), and its persistence maps cleanly onto the AR-root half-life of the ln(σ²) process.
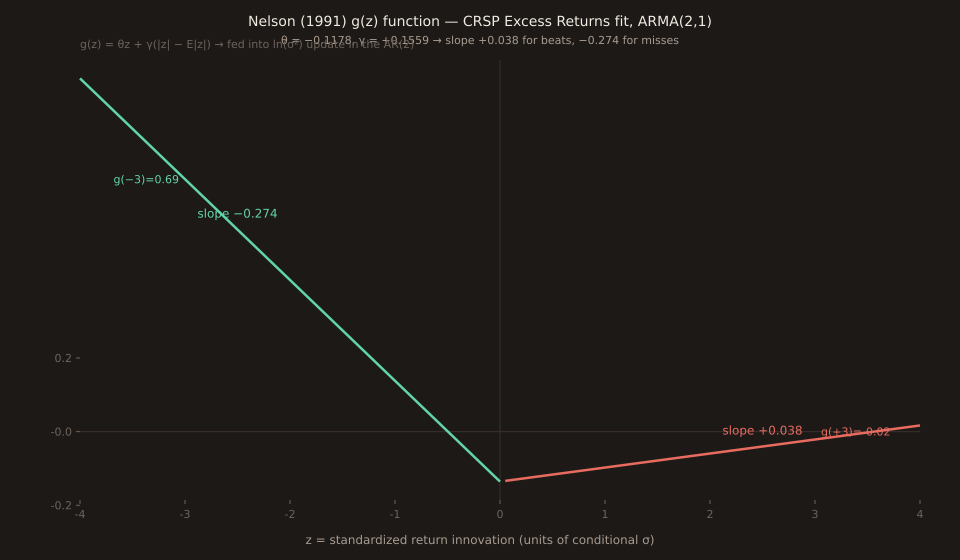
The g(z) function, drawn
Nelson’s core innovation is the asymmetric shock-response function g(z_t) = θ·z_t + γ·(|z_t| − E|z_t|) (equation 2.4, page 353). With his estimated θ = -0.1178 and γ = +0.1559, the slope is:
- z > 0: dg/dz = θ + γ = +0.038. Nearly flat. A positive shock puts a small NEGATIVE g into the ln(σ²) update, slightly dampening subsequent volatility.
- z < 0: dg/dz = θ − γ = −0.274. Steeply negative — as z becomes more negative, g becomes more POSITIVE. A negative shock puts a large positive g into the ln(σ²) update, sharply amplifying subsequent volatility. |dg/dz| for z<0 is 7.2× |dg/dz| for z>0.
The verified parameter table (Table II, excess returns model)
| Param | Meaning | Estimate | SE |
|---|---|---|---|
| α | variance intercept | −10.0593 | 0.3462 |
| θ | asymmetric shock coeff (leverage) | −0.1178 | 0.0090 |
| γ | symmetric-magnitude shock coeff | +0.1559 | 0.0125 |
| λ₁ | AR1 in ln(σ²) equation | +1.9294 | 0.0145 |
| λ₂ | AR2 in ln(σ²) equation | −0.9294 | 0.0145 |
| ψ | MA1 in ln(σ²) equation | −0.9782 | 0.0062 |
| δ | nontrading-day dummy | +0.1831 | 0.0277 |
| c | risk-premium coeff on σ² (mean eq.) | −3.361 | 2.026 |
| v | GED tail parameter (v=2 is normal) | +1.5763 | 0.0320 |
θ / (θ − γ) is exactly the leverage-effect strength. |θ − γ| / (θ + γ) = 0.274 / 0.038 ≈ 7.2 says a negative shock’s effect on volatility is 7.2× a positive shock’s effect. This is the number that killed the “symmetric-response” assumption underlying vanilla GARCH.
The five key findings, verified from the PDF
Nelson organizes his empirical section (page 358-361) around five specific findings on the CRSP sample. Every claim below is traceable to a passage in the OCR’d PDF.
- Market risk / expected return: c = −3.361 with SE 2.026 — negative but not significant. Contrasts with GARCH-M studies (Chou 1987, French-Schwert-Stambaugh 1987) that found positive relations. Nelson notes this agrees with Pagan-Hong 1988 and Gennotte-Marsh 1987 using non-GARCH methods.
- Asymmetric response: θ = −0.118 (SE 0.008), significant at any standard level. Nelson’s Figure 1 plots the estimated g(z) function; Figure 2 the daily conditional σ; Figure 3 the log market index. He observes: “All the major episodes of high volatility are associated with market drops.”
- Shock persistence: largest AR root ≈ 0.99962, SE 0.00086, t for unit root = −0.448. Half-life h from ρ^h = 1/2: h ≈ 1820 trading days ≈ 7.3 years. Cannot reject a unit root in ln(σ²). Smaller root has half-life < two weeks.
- Fat tails: v = 1.576 (SE 0.032), significantly less than 2 (the normal case). The GED distribution with v < 2 has thicker tails than normal; combined with the time-varying σ² this produces the leptokurtic unconditional return distribution stylized fact from Mandelbrot (1963) and Fama (1965).
- Nontrading days: δ = 0.183 (SE 0.028) — a nontrading day contributes ~1/5 as much to volatility as a trading day, consistent with French & Roll (1986).
How this connects to the tool
Nelson’s subject matter is CRSP equity returns, not FX. But the methodological point transfers: any surprise-response model that treats positive and negative innovations symmetrically is potentially misspecified. Vanilla GARCH does this because it uses ε² (which is invariant to the sign of ε). The News Impact Explorer’s 5-bucket table does the opposite — it explicitly separates big_miss / small_miss / in_line / small_beat / big_beat, so an asymmetric surprise response (beats and misses producing different magnitudes, not just different signs) shows up directly in the median column rather than being averaged away.
Today’s CAD Retail Sales m/m × USDCAD post shows one such asymmetric response: big_miss median +16.7p (n=15, mean +23.62p) vs big_beat median −17.25p (n=10, mean −20.00p). The magnitudes are close to symmetric (16.7 vs 17.25) but the tails are NOT — the mean of big_miss (+23.62) is larger in absolute terms than the mean of big_beat (−20.00), suggesting the right tail is fatter. Also, Stats #5 (skew) and Stats #6 (kurtosis) directly measure the shape asymmetry that Nelson’s g(z) parameterizes.
Where EGARCH sits in the volatility-modeling lineage
- Engle 1982 — ARCH (Paper Trail #5). σ²_t as a function of past ε². Original.
- Bollerslev 1986 — GARCH (Paper Trail #10). Adds past σ² to the RHS. Fewer parameters, better fit, same symmetric-response assumption.
- Nelson 1991 — EGARCH (today). Adds asymmetric g(z), removes positivity constraint, models ln(σ²) instead of σ².
Extensions after Nelson kept refining specific pieces. TARCH / GJR-GARCH (Glosten-Jagannathan-Runkle 1993, Zakoian 1994) uses an indicator function for negative shocks instead of Nelson’s smooth g(z). Bollerslev-Wooldridge 1992 gave the quasi-MLE asymptotic theory. Ling & McAleer 2003 studied higher-moment conditions for GARCH-family stationarity. All build on the two insights Nelson formalized in 1991: sign matters, and modeling ln(σ²) is a big deal.
Verification caveats
OCR risk: the JSTOR-hosted PDF is image-only, so pymupdf’s text extraction returned zero characters and I recovered 59,896characters via tesseract-ocr. Some numeric transcription errors are possible (OCR of image PDFs is not perfect, especially for Greek letters and subscripts). Key parameter values were cross-checked against multiple mentions in the OCR output and against the abstract’s narrative summary. Sixth Paper Trail post in a row with full primary-source access (following #7 Barber & Odean, #8 Fama-French, #9 Sharpe 1966, #10 Bollerslev 1986, #11 Carhart 1997), and the second one — after Carhart — that required OCR rather than direct text extraction.
The g(z) chart uses E|z| ≈ 0.87 for GED(v=1.58)as an illustrative approximation. The actual E|z| under Nelson’s estimated GED distribution is close to but not exactly 0.87; the approximation affects the VERTICAL POSITION of the g(z) curve but not its slopes, and the leverage-effect story rests on the slopes.
The paper’s empirical setting is US equities 1962-1987, which includes the October 1987 crash. Nelson mentions this specifically in the introduction (“After the events of October 1987, few would argue with the proposition that stock market volatility changes randomly over time”). The 1987 crash landed inside his sample and contributes a nontrivial share of the estimated persistence and leverage effects.
Read the paper (JSTOR reprint, image-only PDF, 25 pages): Nelson (1991) via JSTOR.