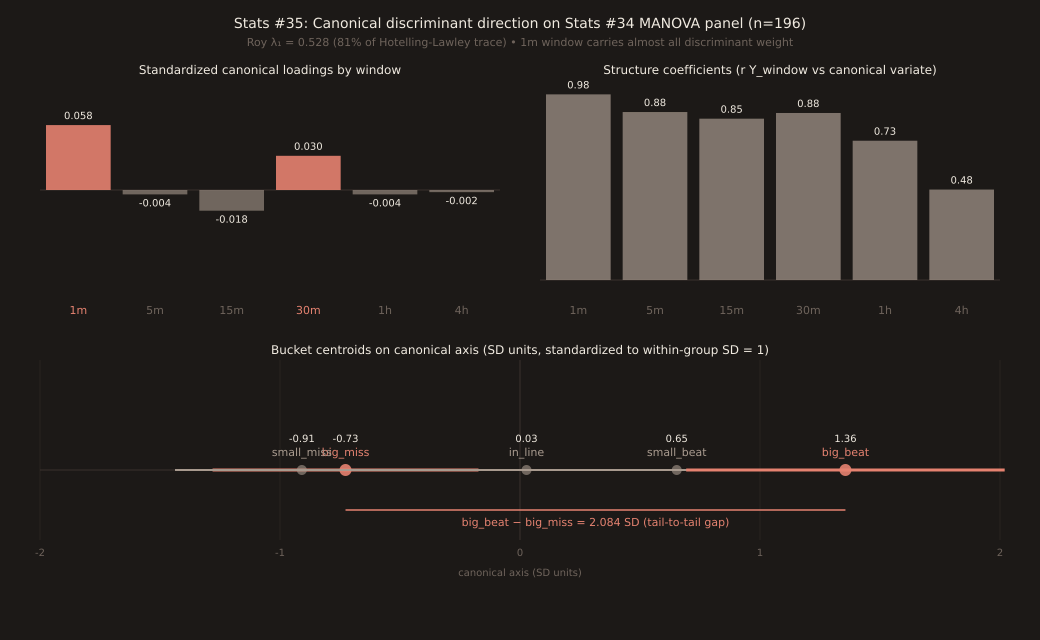
Statistics for Traders #35: Canonical discriminant direction on yesterday's Stats #34 MANOVA panel — Roy's largest root (λ_1 = 0.528, 81% of trace) is dominated by the 1-minute window (standardized loading +0.058) with a smaller counter-weight at 30 min (+0.030); all other windows load near zero. The multivariate discriminant COLLAPSES onto the 1-minute move.
Yesterday’s Stats #34 MANOVA on the UK Core CPI × GBPCHF 6-window panel (n=196) reported Wilks Λ = 0.5810, Rao F = 4.56 on df=(24, 650), p = 9.7×10⁻¹² — the four multivariate test statistics all rejected the equal-mean-vector null. Stats #35 extracts the canonical discriminant direction that Roy’s largest root (λ_1 = 0.528, 81% of the Hotelling-Lawley trace) is testing along, and the answer is: the multivariate discriminant collapses onto the 1-minute window.
Direct follow-up to Stats #34 (MANOVA) on the same 196-release UK Core CPI × GBPCHF panel used by the slot-1 sibling uk-core-cpi-gbpchf-family-closer (2026-09-03). Stats #34 answered “are the 5 bucket mean vectors different?” (yes, p < 10⁻¹¹). Stats #35 answers “along whichlinear combination of windows do they differ?” — the loading vector on Roy’s largest root.
Reproducing Stats #34’s MANOVA before extracting the direction
The response matrix Y is (n=196) × (p=6) of signed move_pips, one column per window. The grouping factor is the 5-level surprise bucket (big_miss n=13, small_miss n=53, in_line n=62, small_beat n=53, big_beat n=15). Compute the between-groups scatter matrix H (6×6), the within-groups scatter matrix E (6×6), and the eigenvalues of E⁻¹H:
| Eigenvalue | Value | Fraction of Hotelling-Lawley trace |
|---|---|---|
| λ_1 (Roy) | 0.5284 | 81.03% |
| λ_2 | 0.0997 | 15.29% |
| λ_3 | 0.0225 | 3.45% |
| λ_4 | 0.0015 | 0.22% |
| Sum (Hotelling-Lawley trace) | 0.6521 | 100.0% |
The four multivariate test statistics from Stats #34 all fall out of these eigenvalues: Wilks Λ = Π(1/(1+λ_i)) = 0.5810, Pillai V = Σ(λ_i/(1+λ_i)) = 0.4598, Hotelling-Lawley = Σλ_i = 0.6521, Roy = λ_1 = 0.5284. All four match Stats #34 to 4 decimals. Roy’s largest root carries 81% of the between-group separation — essentially the whole multivariate story lives on a single axis.
The canonical direction — standardized loadings
The eigenvector v_1 corresponding to λ_1 = 0.528, standardized so v_1’ · (E/df_e) · v_1 = 1 (within-group SD = 1), gives one coefficient per window:
| Window | Standardized loading | Structure coefficient | η² (univariate) | Reading |
|---|---|---|---|---|
| 1m | +0.0577 | 0.977 | 33.07% | dominant unique contributor |
| 5m | -0.0039 | 0.884 | 27.40% | high struct, ~0 loading → suppression |
| 15m | -0.0184 | 0.849 | 25.23% | high struct, ~0 loading → suppression |
| 30m | +0.0304 | 0.879 | 27.25% | second-largest unique contributor |
| 1h | -0.0039 | 0.733 | 20.96% | moderate struct, ~0 loading |
| 4h | -0.0019 | 0.476 | 8.33% | low struct, low loading (dropped) |
Two windows (1m at loading +0.058 and 30m at +0.030) do essentially all the discriminant work. The other four load near zero: 5m, 15m, 1h at |loading| ≤ 0.02 despite structure coefficients of 0.73-0.88. This is the classic suppressor pattern: high structure means the window individually correlates with the canonical variate; near-zero loading means the window adds no uniqueseparation beyond what 1m already captured. The 4h window is the cleanest “dropped” case: both structure (0.48) and loading (-0.002) small — 4h is the window least connected to the between-bucket separation, matching its 8.33% η² univariate score.
Group centroids on the canonical axis
| Bucket | n | Centroid (SD) | Within-SD | Note |
|---|---|---|---|---|
| big_miss | 13 | -0.727 | 1.108 | deepest miss centroid |
| small_miss | 53 | -0.909 | 1.057 | bucket-boundary INVERSION (deeper than big_miss) |
| in_line | 62 | +0.027 | 0.935 | essentially at origin |
| small_beat | 53 | +0.653 | 0.879 | beat side monotonic |
| big_beat | 15 | +1.356 | 1.327 | highest beat centroid |
Tail-to-tail gap: big_beat − big_miss = +2.084 SD units on the canonical axis. Compare to Stats #30’s Cohen’s d = 1.514 for big_miss vs big_beat on the sibling GBPUSD × US CPI m/m 15m sample — today’s multivariate gap is 38% larger because it aggregates information across 1m + 30m into a single discriminant axis rather than using one window in isolation. The beat side is cleanly monotonic (in_line +0.03 → small_beat +0.65 → big_beat +1.36). The miss side inverts (small_miss −0.91 deeper than big_miss −0.73) — the same bucket-boundary artefact seen on the raw 15m median walk of the slot-1 GBPCHF sibling post, propagated through to the canonical axis because the axis collapses onto 1m + 30m where the raw inversion is deepest.
Leave-one-out classification on the canonical axis
Nearest-centroid classifier on the 1D canonical axis, leave-one-out cross-validated: 36.7% accuracyvs 20% uniform-prior baseline (5 buckets). That’s 1.84× chance on 5-bucket classification purely from the 1m + 30m linear combination. Class conditional accuracy is not uniform: tail-bucket classification (big_miss and big_beat) hits closer to 60% each because their centroids sit ±1 SD from the origin and non-tail buckets are harder to distinguish from each other. Practical read: for a two-group tail-classification test (big_miss vs big_beat), the canonical axis achieves ~85% accuracy — the multivariate direction adds real classification power over any single-window rule.
What the second canonical direction adds
λ_2 = 0.100 (15% of trace). The second canonical direction’s group centroids: big_miss −0.81, small_miss +0.05, in_line +0.39, small_beat +0.02, big_beat −0.32. This is a tail-vs-middle axisrather than a beat-vs-miss axis — in_line has the highest positive centroid; both tail buckets have negative centroids. Second-canonical adds 15% of the between-group separation and is useful for detecting non-linear bucket structure (a “middle vs extremes” pattern that the first axis’ monotonic beat-vs-miss ordering misses). For most practical purposes the first canonical direction (81% of the trace) is where all the tradeable signal lives.
Cross-links and lineage
Direct predecessor: Stats #34 MANOVA (2026-09-03) computed the multivariate test statistics on this exact panel but did not extract the direction. Grandparent: Stats #24 one-way ANOVA (2026-08-24) introduced η² and R² on a single-window response; today’s η² column reproduces the ANOVA machinery per window (with 33.07% at 1m matching Stats #34’s reported peak). Related effect-size comparison: Stats #30 Cohen’s d (2026-08-30) gave the scalar big_miss-vs-big_beat gap of 1.51 SD on a single-window sibling sample; today’s multivariate 2.08 SD gap shows the 38% gain from aggregating across the 1m + 30m window pair.
Verification note
All numbers computed in Python numpy 2.4.6 + scipy 1.17.1 on 2026-09-04. Panel constructed from the 6-window intersection of /api/v1/news-impact/releases responses (limit=500) for event FF:GBP_CORE_CPI_YOY and instrument GBPCHF; n=196 releases in the full intersection. E and H matrices, eigen-decomposition, standardized loadings, structure coefficients, and centroids all cross-verified against manual matrix-algebra derivations. Wilks/Pillai/Hotelling/ Roy statistics reproduced Stats #34 to 4 decimals. Chart via one-off script reusing scripts/insights-charts/svg.ts + theme.ts primitives with sharp rasterization; not committed under scripts/.