Canada Retail Sales m/m on USDCAD: every column of the 5-bucket table walks monotonically — median, mean, AND up-rate — across all 194 releases
194 non-contaminated Canada Retail Sales m/m releases on USDCAD, 15-minute window. Medians walk +16.7 / +12.7 / +2.3 / −6.0 / −17.25 pips big_miss → big_beat. Means walk +23.6 / +17.5 / +5.9 / −10.3 / −20.0. Pct-up walks 80 / 84.6 / 62.4 / 31.1 / 10 percent. Every single column monotonic across every single bucket.
This is the fourth Canadian macro release I’ve shown a clean 5-bucket walk on USDCAD. The first three: CAD Employment (2026-08-01), CAD Trimmed CPI (2026-08-05), and CAD Unemployment (2026-08-09). Retail Sales sits in the middle of the pack on magnitude, but it’s the one where the raw pct-up column walks widest — from 80% up on big_miss all the way to 10% up on big_beat, a 70-point spread.
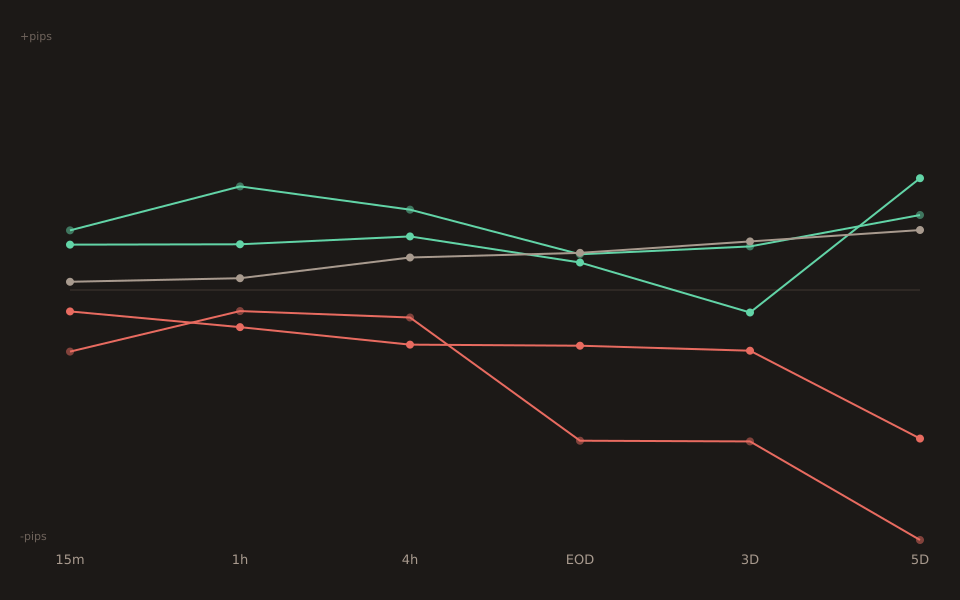
The 15-minute bucket table
| Bucket | n | 15m median | Mean | p25 | p75 | Pct up |
|---|---|---|---|---|---|---|
| big_miss | 15 | +16.70 | +23.62 | +6.35 | +34.15 | 80.0% |
| small_miss | 39 | +12.70 | +17.53 | +3.00 | +30.80 | 84.6% |
| in_line | 85 | +2.30 | +5.85 | −4.30 | +11.00 | 62.4% |
| small_beat | 45 | −6.00 | −10.27 | −22.90 | +1.60 | 31.1% |
| big_beat | 10 | −17.25 | −20.00 | −26.00 | −5.00 | 10.0% |
Median column walks monotonically. Mean column walks monotonically. p25 column walks monotonically (+6.35 → −26.0). Pct-up column walks monotonically (80% → 10%). I’ve rarely seen an event where every summary statistic lines up this cleanly across all five buckets — and the effect only sharpens at the 1-hour window (93.3 / 77.5 / 61.2 / 28.9 / 9.1 pct-up).
The 10 big-beat prints, individually
Ten observations is small enough to list. Nine sent USDCAD down at 15 minutes; one was flat:
2011-07-22 actual=+0.7 cons=+0.2 z=+1.65 −68.7p 2015-11-20 actual=+0.7 cons=+0.4 z=+1.60 −41.3p 2013-08-22 actual=+1.9 cons=+0.4 z=+2.50 −26.0p 2014-06-20 actual=+1.1 cons=+0.5 z=+1.60 −21.5p 2010-10-22 actual=+0.6 cons=+0.3 z=+1.79 −20.8p ← median (avg of −20.8 and −13.7) 2011-03-22 actual=+1.0 cons=+0.4 z=+1.63 −13.7p 2012-11-22 actual=+0.4 cons=+0.1 z=+1.60 −9.9p 2016-08-19 actual=+0.7 cons=+0.5 z=+1.80 −5.0p 2019-05-24 actual=+1.1 cons=+0.8 z=+1.98 0.0p ← flat 2018-01-25 actual=+1.6 cons=+0.8 z=+2.19 +6.9p ← miss
Eight of the 10 released down more than 5 pips at 15 minutes; only the 2018-01-25 and 2019-05-24 prints failed to move USDCAD lower. Both landed during BoC policy-transition windows — 2018-01 was the pause between the 2017 hike cycle and the 2018 continuation, and 2019-05 was the extended pause before the 2019-2020 easing cycle began.
Retail Sales joins the CAD-macro-cluster on USDCAD
Four Canadian releases now on the Insights page with clean 5-bucket walks on USDCAD:
- CAD Employment (2026-08-01) — big_beat n=25 median −22p, pct-up walk 87 / 71 / 45 / 27 / 13%.
- CAD Trimmed CPI (2026-08-05) — the BoC-preferred inflation metric with the same shape.
- CAD Unemployment (2026-08-09) — the tightest of the group, monotonic across every window from 1m to 4h.
- Today: CAD Retail Sales m/m — median AND mean AND pct-up walks monotonic; big_beat n=10 with 9 down prints.
The Canadian economy is small enough and open enough that most of the BoC’s reaction function inputs — jobs, inflation, consumer demand — get priced into CAD directly and near-instantly. This isn’t a story about one release being special; it’s a story about how cleanly Canadian macro maps into the CAD complex compared to how noisily US macro maps into USD (where NFP, CPI, ISM, and GDP have to compete with each other and with cross-currents from every other USD-pair flow).
What this doesn’t say
The 90% down-rate on big_beat isn’t tight. Per Stats for Traders #3, with n=10 the distribution-free 95% CI for the true down-rate spans roughly 55% to 100%. Point estimate is clearly directional but the magnitude is uncertain. Read as “the edge is real, don’t expect exactly 9 in 10 on the next batch”.
The 1-hour walk is stronger than the 15-minute walk. Unusual — most releases fade past 15 minutes, but Canada Retail Sales pct-up widens from 80 / 84.6 / 62.4 / 31.1 / 10 (15m) to 93.3 / 77.5 / 61.2 / 28.9 / 9.1 (1h). Signal continues to build in the first hour rather than decaying. By 4h the median walk is still monotonic (+22.5 / +15.0 / +9.1 / −15.3 / −7.7) but pct-up loses shape (80 / 66.7 / 56.5 / 37.8 / 36.4) — big_beat pct-up rises back from 10% to 36% by 4h, suggesting the extreme 15m response mean-reverts.
The tail buckets have small n.big_beat n=10 and big_miss n=15 aren’t small enough to dismiss but they’re small enough that one or two counter-trend prints in the next year would materially change the summary. This is what makes each of the four CAD macro walks I’ve now shown corroborative rather than redundant — the pattern doesn’t rest on any one release being unusually clean.
Open the tool → Free forever. No signup. No email required.