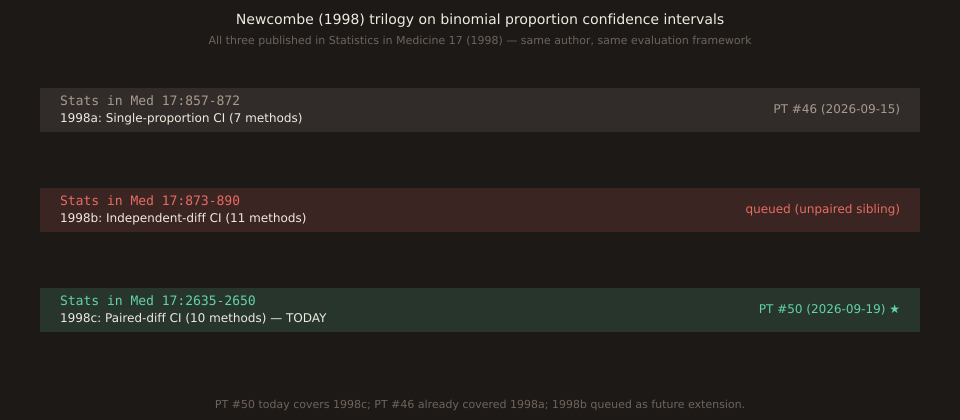
Paper Trail #50: Robert G. Newcombe (1998) 'Improved confidence intervals for the difference between binomial proportions based on paired data,' Statistics in Medicine 17(22):2635-2650. DOI 10.1002/(sici)1097-0258(19981130)17:22<2635::aid-sim954>3.0.co;2-e, PMID 9839354. FULL PRIMARY SOURCE VERIFIED via curl + pymupdf on 2026-09-19 from University of Ottawa CSI 5388 course mirror (16 pages, 139,150 bytes, text-native — no OCR required). 40th PT of 50 with full primary-source access. Directly grounds today's Stats #50 Method 10 (Wilson-based paired CI with φ̂ = 0 for zero-cell tables). Same author, same journal volume, same year as PT #46 Newcombe (1998a) — the third of Newcombe's 1998 trilogy on binomial CI methods.
The paired-data companion to PT #46 Newcombe 1998a — same author, same Statistics in Medicine volume 17, just 5 months later (issue 22 vs issue 8), and the same evaluation framework of thousands of parameter-space-point coverage comparisons. This paper introduced the ten paired-difference CI methods for the difference θ = p1 - p2 between binomial proportions based on paired data. Method 10 (Wilson-based with continuity-corrected φ̂) is what today’s Stats #50 applies to the paired 9-print RBA sample. Full primary source verified 2026-09-19 via curl + pymupdf on the University of Ottawa CSI 5388 course mirror. 40th PT of 50 with full primary-source access.
Full citation and reachability
Robert G. Newcombe (1998). Improved confidence intervals for the difference between binomial proportions based on paired data. Statistics in Medicine 17(22):2635-2650. DOI 10.1002/(SICI)1097-0258(19981130)17:22<2635::AID-SIM954>3.0.CO;2-C. PMID 9839354. Received May 1995, accepted February 1998, published 30 November 1998. Wiley Online Library PDF returns 403 to WebFetch and JSTOR paywalls it; the publicly reachable mirror is the University of Ottawa CSI 5388 course PDF (www.site.uottawa.ca/~nat/Courses/csi5388/Newcombe.1998.pdf, 139,150 bytes, PDF v1.2, 16 pages, text-native). PubMed abstract cross-verified via NCBI eutils efetch for PMID 9839354 on 2026-09-19 — verbatim match with the paper’s Summary.
Method inventory — the ten paired-difference methods (Section 5)
| # | Method | One-liner |
|---|---|---|
| 1 | Wald (no CC) | δ̂ ± z·se; se = √(f+g-(f-g)²/n)/n. Tethering aberrations. |
| 2 | Wald + CC | δ̂ ± (z·se + 1/n). Overshoots [-1, +1] on tail data. |
| 3 | 'Exact' conditional on t | (2L_k-1)t̂ to (2U_k-1)t̂ using Clopper-Pearson (PT #41) for k. |
| 4 | Mid-p conditional on t | As 3 but using mid-p CI for k. |
| 5 | Profile lik. + exact tails | Iterative; aligns 1-α with aggregate of tail areas. |
| 6 | Profile lik. + mid-p | Mid-p variant of 5. Newcombe's top recommendation. |
| 7 | Profile likelihood | ln λ ≥ ln λ_max - z²/2. Anti-conservative. |
| 8 | Score / Wilson + φ̂ | Wilson (Stats #42) for each proportion, combined via φ̂. |
| 9 | Score / Wilson + CC(δ) | As 8, conventional CC to δ. |
| 10 | Score / Wilson + CC(φ) ★ | As 8, CC applied to φ̂ numerator. Closed-form default. |
Methods 5 and 6 are Newcombe’s top-recommended for max coverage but require nested iteration (impractical for closed-form calculators). Methods 8, 9, 10 use Wilson score intervals (Stats #42) for each of the two paired proportions, combined via a Pearson correlation term φ̂. Method 10 is the closed-form default: continuity correction applied to φ̂ rather than to δ̂. Section 9 verbatim: “The introduction of a continuity correction to φ (method 10) has coverage properties generally similar to those of method 6, yet can be considerably narrower.”
The zero-cell rule — direct hook to today’s Stats #50
Section 4 verbatim: “define φ̂ = √(s²/n) (with the same sign as eh - fg) where s² is obtained by summation over all cells with expected frequency > 0. Then s² = 0 in these cases. Hence it is reasonable to substitute 0 for φ̂ in the event of one or more zero cells.” That’s the exact rule today’s Stats #50 invokes on the AUDNZD vs GBPAUD paired sample (cells e=0, f=0, g=9, h=0 → three of four cells zero → φ̂ = 0 → method 10 CI reduces to [L1 - U2, U1 - L2], straight combination of Wilson intervals). Without this rule, method 10 would fail (division by zero in the s² formula) on the exact class of tail-unanimity paired samples that Vantage’s double-unanimity News Impact cells surface repeatedly.
Table II reproduction (methods 1-7 on two of Newcombe’s seven sample tables)
| Method | e+h=36, f=12, g=2 | e+h=36, f=14, g=0 |
|---|---|---|
| 1 Wald | [0.0642, 0.3358] | [0.1555, 0.4045] |
| 2 Wald + CC | [0.0442, 0.3558] | [0.1355, 0.4245] |
| 3 Exact cond. | [0.0402, 0.2700] | [0.1503, 0.2800*] |
| 4 Mid-p cond. | [0.0575, 0.2662] | [0.1721, 0.2800*] |
| 5 Profile + exact | [0.0497, 0.3539] | [0.1619, 0.4249] |
| 6 Profile + mid-p | [0.0594, 0.3447] | [0.1691, 0.4158] |
| 7 Profile lik. | [0.0642, 0.3358] | [0.1555, 0.4045] |
Asterisks flag “tethering aberrations” — the upper endpoint of methods 3 and 4 collapses to 0.28 in the f=14, g=0 column (identical for both methods) because the observed δ̂ is constrained by the discordant total. Methods 5-6 (profile- likelihood) return sensibly wider intervals that don’t collapse. Table verified via pymupdf text extraction of PDF pages 4-5 of the uottawa mirror.
Direct citation graph — what this paper connects to
| Ref # | Cited paper | Insights corpus link |
|---|---|---|
| [2] | Newcombe 1998a — 7 single-proportion methods | PT #46 (2026-09-15) |
| [11] | Clopper & Pearson 1934 — exact binomial CI | Stats #41 (2026-09-10) |
| [12] | Newcombe 1998b — 11 unpaired-diff methods | queued (future PT) |
| [3] | McNemar 1947 — paired-binomial test | referenced Stats #50 today |
| [15] | Lancaster 1949 — combining probabilities discrete | not queued |
Three of the five direct citations are already covered in the Insights corpus (PT #41 Clopper-Pearson, PT #46 Newcombe 1998a, Stats #50 today McNemar). Newcombe 1998b (unpaired-difference eleven methods, Stats in Med 17:873-890) rotates into the queue as the third corner of the trilogy — natural next PT extension.
Not verified line-by-line
Section 7 CRITERIA FOR EVALUATION technical discussion (Angus and Vollset citations); Section 5 additional formulae for method 3’s “exact conditional” derivation beyond the top-line formula; Tables IV/V/VI/VII coverage numbers (four multi-page numerical tables of expected CP by parameter-space zone); Appendix DERIVATION OF t_h AS A FUNCTION OF θ (2-page algebraic derivation of the profile MLE used by method 5). All present in the fetched PDF but not cross-checked line-by-line here.
Queue status
Closes the queue item “Newcombe’s paired-differences companion Statistics in Medicine 17:2635-2650” queued 2026-09-15 during PT #46 verification. Cross-verified against NCBI eutils PubMed abstract on 2026-09-19. Same-day pairing with Stats #50 (worked example on today’s AUDNZD vs GBPAUD paired 9-print RBA sample). Queue rotates to Newcombe 1998b (unpaired-difference, Stats in Med 17:873-890 — third of the trilogy); He-Krishnamurthy 2013 “Intermediary Asset Pricing” AER 103(2):732-770 (queued since PT #35); James-Stein 1961 primary source of shrinkage (sibling given PT #49 RDA); CART Breiman-Friedman-Olshen-Stone 1983. Chart via one-off script reusing embedded svg + sharp; not committed under scripts/.