Statistics for Traders #6: fat tails, kurtosis, and why NFP's 'in-line' bucket contains the biggest outlier moves in the dataset
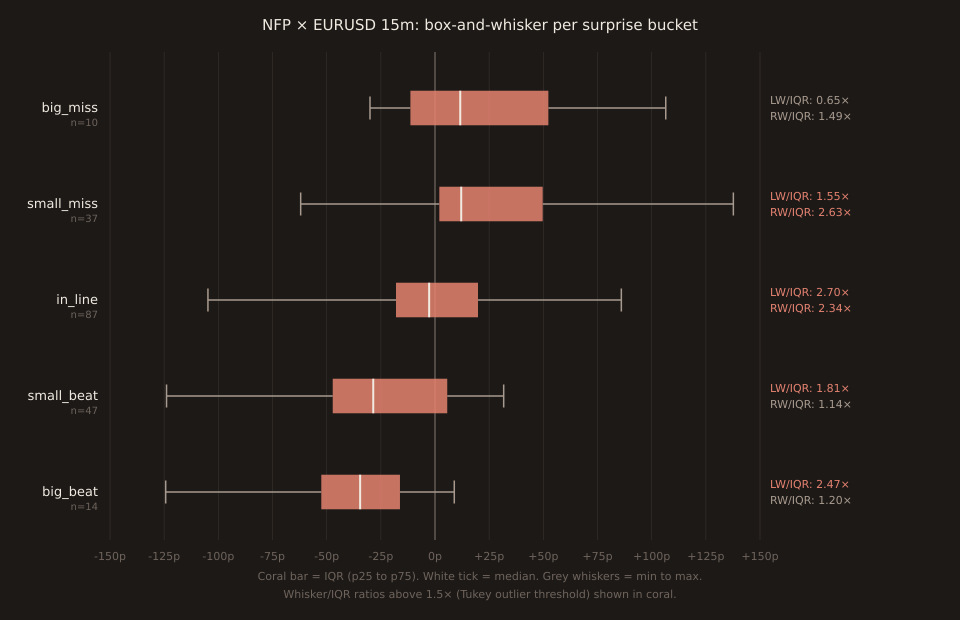
The in_line bucket on NFP × EURUSD 15m has an IQR of 37.9 pips (p25 −18.0 to p75 +19.9). A normal-shaped distribution would put its whiskers within about 1.5× of that IQR under a standard Tukey outlier fence. This bucket’s left whisker is 102.1p (2.70× IQR); its right whisker is 88.7p (2.34× IQR). Both tails are more than 50% fatter than Tukey’s threshold, and the min-move print is −104.8 pipson a 165k-versus-146k-forecast NFP that the surprise-bucketing algorithm sensibly labelled “in line”.
Stats #5 introduced skew — asymmetry, which side of the median gets a longer tail. This post is about the independent property: tail-thickness. A bucket can be perfectly symmetric and still have fat tails. In_line NFP EURUSD is that shape: both sides walk out to roughly the same distance beyond the IQR, and that same distance is much bigger than a bell curve would predict.
What kurtosis is measuring
In introductory statistics, kurtosis is a fourth-moment property computed from every observation in the sample. For our purposes that formal definition is more machinery than we need — the practical question is only “how far do the tails reach past the middle 50%.” The tool already exposes both halves of that ratio directly:
IQR = p75 - p25 left_whisker = median - min right_whisker = max - median LW / IQR = left tail-length in units of IQR RW / IQR = right tail-length in units of IQR Tukey rule of thumb: whisker / IQR ≤ 1.5 → thin/normal tail on that side whisker / IQR > 1.5 → fat tail on that side (would flag outliers)
The Tukey 1.5× fence is the same threshold that box-plot software uses to draw outlier dots — the convention is that observations beyond p75 + 1.5×IQR (or p25 − 1.5×IQR) are “flagged” as outliers. When a whole side of a distribution sits beyond that fence, you don’t have a single outlier; you have a fat tail.
The five-bucket kurtosis table
| Bucket | n | IQR | Left whisker | Right whisker | LW / IQR | RW / IQR |
|---|---|---|---|---|---|---|
| big_miss | 10 | 63.7 | 41.6 | 94.8 | 0.65× | 1.49× |
| small_miss | 37 | 47.7 | 74.1 | 125.6 | 1.55× | 2.63× |
| in_line | 87 | 37.9 | 102.1 | 88.7 | 2.70× | 2.34× |
| small_beat | 47 | 52.8 | 95.4 | 60.2 | 1.81× | 1.14× |
| big_beat | 14 | 36.3 | 89.7 | 43.5 | 2.47× | 1.20× |
Coral cells flag whisker/IQR ratios above 1.5× (Tukey’s outlier threshold). Note the in_line row — the bucket most traders think of as “boring” — carries the fattest tails in the whole table. 2.70× on the left and 2.34× on the right; both sides fat.
The five biggest in_line down-moves, individually
Since the outlier story rests on specific prints, let’s see them. Top five DOWN-moves in the in_line bucket, sorted by move_pips:
2013-05-03 165k vs 146k fc z=+0.32 -104.80p ← min 2022-12-02 263k vs 200k fc z=+0.31 -93.90p 2014-10-03 248k vs 216k fc z=+0.49 -88.60p 2015-02-06 257k vs 236k fc z=+0.38 -85.90p 2015-05-08 223k vs 228k fc z=-0.08 -75.70p
And top five UP-moves in the same bucket:
2021-06-04 559k vs 645k fc z=-0.03 +36.40p 2016-09-02 151k vs 180k fc z=-0.40 +61.90p 2021-05-07 266k vs 990k fc z=-0.25 +64.40p 2026-07-02 57k vs 43k fc z=+0.20 +64.90p 2013-08-02 162k vs 184k fc z=-0.44 +86.00p ← max
Look at the surprise_z column: every single one of these ten prints was inside |z| < 0.5. The consensus and the actual print were close enough that the tool bucketed them as “in-line.” And yet the pair moved 75 to 104pips in one direction within 15 minutes. These aren’t surprise-driven moves; they’re something-else-in-the-release moves. The 2013-05-03 print, for example, came with a large upward revision to the prior two months’ NFP counts — that revision was the tape-mover, not the headline number the surprise_z scored.
Why fat tails matter for sizing
Suppose you set your stop at the p25/p75 boundaries of the in_line bucket — ±20 pips around your entry. If the distribution were normal-shaped, that stop would get triggered on roughly 25%of prints (by definition, since p25/p75 are the 25th and 75th percentiles). Fine. But the distribution ISN’T normal — it has fat tails. And the fat tails don’t come as slightly-worse-than-p25 moves; they come as the −105p print from May 2013. Your −20p stop absorbs the full brunt of that whisker outcome roughly as often as the small p25-adjacent moves.
The concrete adjustment: for a bucket where the whisker/IQR ratios exceed 1.5×, add a fat-tail multiplier of ~2× to the outer bound of your stop, or use the min/max directly (rather than the IQR) as the sizing anchor. Either translates to “this bucket needs more risk capital than the p25/p75 alone suggests”.
Skew and kurtosis are independent
Compare the in_line bucket (RW 2.34×, LW 2.70×, similar to each other) with the small_miss bucket (RW 2.63×, LW 1.55×, asymmetric). Both are fat-tailed, but only small_miss is skewed: its right whisker is much longer than its left, meaning “a small NFP miss occasionally produces very large EURUSD up-moves.” The in_line bucket is symmetric but fat-tailed on both sides — you get equally-often-big moves in either direction.
Skew tells you WHICH SIDE the outliers are on. Kurtosis tells you HOW FAR they reach. A bucket can be either or both. Read them separately.
What this doesn’t say
Small-n caveats compound on ratio measures. big_miss has n=10 and big_beat has n=14 — these buckets’ min and max are single observations, which means their LW/IQR and RW/IQR ratios can shift dramatically with one added or removed print. Treat the fat-tail flag on small buckets as directional signal, not point estimate.
The 1.5× Tukey threshold is a convention, not a law. It corresponds roughly to flagging observations beyond ±2.7σ if the underlying distribution were normal. For a genuinely fat-tailed distribution (like FX 15-minute moves around a macroeconomic release), a normal-distribution-derived threshold under-flags. The 1.5× threshold is the standard reference line; the actual practical fat-tail warning level is higher.
The in_line outliers aren’t “wrong” classifications.The tool computes surprise_z from the headline NFP change vs consensus. That’s the right signal to bucket on for “what does the surprise size predict.” The fat tails in the in_line bucket exist because NFP releases contain more than one number — the household survey, wage growth, participation, benchmark revisions — and any of those can move the pair even when the headline is in line. If you wanted to remove those tail moves from the in_line bucket, you’d need to re-bucket on a composite surprise score that included every release component, which the tool doesn’t currently do.
Open the NFP EURUSD bucket table → Free forever. No signup. No email required.