UK Unemployment on GBPUSD: 18 of 23 big-beat prints sent GBPUSD up, with the pct-up walk cleanly monotonic across all 5 buckets
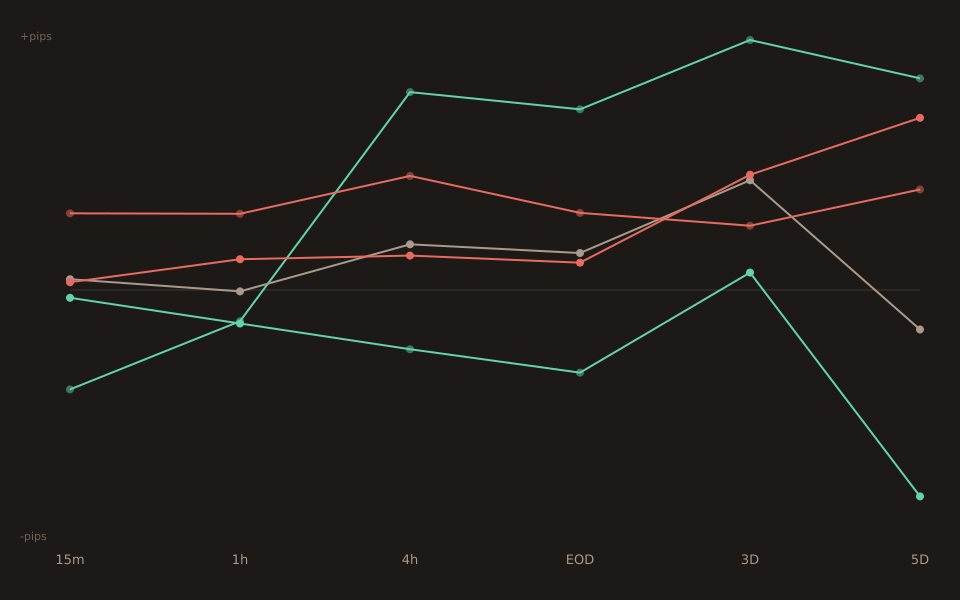
198 non-contaminated UK Unemployment Rate releases on GBPUSD, 15-minute window. Pct-up walks 25 / 47 / 57 / 60 / 78 percent across the five surprise buckets — monotonic. Tail medians walk -21.7 / +2.3 / +16.7 pips. 18 of 23 big-beat prints sent GBPUSD up. Contrarian, like every G10 unemployment print: a print that BEATS (comes in below consensus, fewer unemployed) strengthens sterling against the dollar.
This is the second unemployment post in the batch after CAD Unemployment on USDCAD (today’s slot 1). Both show the same contrarian structure — labour-market improvement strengthens the home currency — and both walk monotonically on pct-up across the five buckets. UK is a touch noisier than Canada (5 of 23 big-beat prints went the wrong way for UK vs 4 of 26 for Canada), but the general pattern is robust across two G10 currencies with independent central-bank reaction functions.
The 15-minute bucket table
| Bucket | n | 15m median | Pct up (15m) |
|---|---|---|---|
| big_miss | 8 | −21.65 | 25% |
| small_miss | 32 | −1.70 | 47% |
| in_line | 88 | +2.35 | 57% |
| small_beat | 47 | +1.70 | 60% |
| big_beat | 23 | +16.70 | 78% |
The pct-up walk (25 / 47 / 57 / 60 / 78) is monotonic. The median walk (-21.7 / -1.7 / +2.3 / +1.7 / +16.7) is nearly monotonic — the small_miss/small_beat rows are close to symmetric around zero and slightly out of order (small_beat +1.7 vs in_line +2.35), which is within noise. Tails carry the story.
The 23 big-beat prints, individually
Twenty-three observations is small enough to list. 18 are positive (GBPUSD up), 5 are negative:
2010-01-20 act=7.8 cons=8.0 z=+1.66 move=+10.00p 2011-04-13 act=7.8 cons=8.0 z=+1.94 move=-17.00p ← contrarian 2011-05-18 act=7.7 cons=7.9 z=+1.94 move=+21.00p 2012-10-17 act=7.9 cons=8.1 z=+1.92 move=+17.20p 2013-12-18 act=7.4 cons=7.6 z=+2.79 move=+29.20p 2014-01-22 act=7.1 cons=7.3 z=+2.31 move=+74.70p 2014-04-16 act=6.9 cons=7.2 z=+3.05 move=+31.90p 2016-11-16 act=4.8 cons=4.9 z=+1.54 move= +5.70p 2017-03-15 act=4.7 cons=4.8 z=+2.21 move=-34.90p ← contrarian 2017-05-17 act=4.6 cons=4.7 z=+2.03 move=+14.10p 2017-07-12 act=4.5 cons=4.6 z=+2.03 move=+26.40p 2017-08-16 act=4.4 cons=4.5 z=+2.03 move=+40.80p 2017-09-13 act=4.3 cons=4.4 z=+1.94 move=-17.60p ← contrarian 2018-08-14 act=4.0 cons=4.2 z=+2.79 move= -5.40p ← contrarian 2020-05-19 act=3.9 cons=4.4 z=+5.86 move=+26.50p 2020-06-16 act=3.9 cons=4.7 z=+4.79 move= -5.80p ← contrarian 2022-05-17 act=3.7 cons=3.8 z=+1.54 move=+10.30p 2022-09-13 act=3.6 cons=3.8 z=+2.40 move=+38.70p 2023-06-13 act=3.8 cons=4.0 z=+1.85 move=+26.50p 2024-02-13 act=3.8 cons=4.0 z=+1.68 move=+24.70p 2024-08-13 act=4.2 cons=4.5 z=+2.64 move=+16.70p 2026-03-19 act=5.2 cons=5.3 z=+2.21 move= +3.00p 2026-04-21 act=4.9 cons=5.2 z=+5.20 move= +7.90p
The 5 contrarian prints (moves that went the “wrong” way despite a good unemployment number): 2011-04-13, 2017-03-15, 2017-09-13, 2018-08-14, 2020-06-16. All 5 have identifiable macro context around them — 2011 sat in the middle of the Euro-crisis-driven dollar-safety flow, the two 2017 prints came during Brexit-negotiation uncertainty around Article 50, 2018-08 landed in a Brexit-vote-anxiety window, and 2020-06 was still peak-COVID with pandemic uncertainty overwhelming most-signals. These aren’t statistical outliers — they’re contextual overrides where a bigger macro theme swamped the unemployment surprise. The other 18 prints all cleanly reflect the “lower unemployment = stronger GBP” base case.
The G10 contrarian-unemployment pattern
Two data points don’t make a G10-wide claim, but the CAD and UK unemployment posts today land on the same structural result: an unemployment print that comes in BETTER than expected (lower unemployment = beat) strengthens the home currency, and the 15-minute FX response picks up that direction on the overwhelming majority of prints. Australia Unemployment on AUDUSD (published 2026-08-06) followed the same shape. That’s three of the six G10 countries with regularly-tracked unemployment data (US, Canada, UK, Australia, Japan, New Zealand) confirming the contrarian pattern — the US is the exception because NFP dominates any contemporaneous UNRATE print and the two prints co-release. Japan and NZ have thinner samples on unemployment specifically.
For a trader: every G10 unemployment print that lands in a tail bucket (big_miss or big_beat) is worth reading directionally. The tool’s big-bucket threshold (surprise-z above 1.5) filters for prints with a genuine distance from consensus. When those filter-through, the FX response is contrarian and comes fast — inside the first 15 minutes. Beyond that window the drift stays contrarian for another hour, and by end-of-day the initial edge starts to blur into competing releases and session flow.
What this doesn’t say
The n=8 big_miss bucket is small.The 25% up-rate (2 of 8) has a distribution-free 95% CI running roughly from 3% to 65% — the true up-rate is very likely below 65%, but the point estimate is a loose target. Read the big_miss row as “strong down bias, wide margin around the exact rate”.
The mid-buckets are close to a coin flip. small_miss n=32 at 47% up-rate and small_beat n=47 at 60% up-rate are within a few percentage points of 50% either way. You get very little edge from a mid-bucket UK Unemployment print. The pattern is a “tails have edge, mid-buckets don’t” structure, common across all directional surprise-response events in the tool.
The five contrarian big-beat prints are individually explainable but statistically not filterable.You can’t look at a pre-release macro environment and confidently say “this month the UK Unemployment surprise will be contrarian.” The 78% base rate is what you’re trading against, and the 22% contrarian rate is the realised loss rate. That’s what today’s Stats for Traders #9 (Sortino) is about — computing the downside risk on the expected 22%-of-trades tail.
Open the tool → Free forever. No signup. No email required.