Canada GDP m/m on USDCAD: 24 of 24 big-miss and small-miss combined pct-up walks monotonically 87.5% → 72.7%, and the beat side saturates — small_beat median (−6.4p) is bigger than big_beat median (−4.5p)
198 non-contaminated Canada GDP m/m releases on USDCAD, 15-minute window, five surprise buckets. Miss side is textbook: +16.60 / +8.00 / +0.80 pip median walk with pct-up 87.5% / 72.7% / 50.8% — perfectly monotonic across both metrics. Beat side saturates: small_beat median (−6.40p) is BIGGER in magnitude than big_beat median (−4.50p), and pct-up sits flat at ~35% across both beat buckets.
This is the USDCAD variant of the Canada GDP × CADJPY post from 2026-08-15, which had perfectly monotonic pct-up 26.1 / 27.3 / 50.0 / 70.8 / 90.9across all five buckets on the JPY cross. Same event, same 2020-05-29 COVID “wrong-way” big-beat outlier, different beat-side shape.
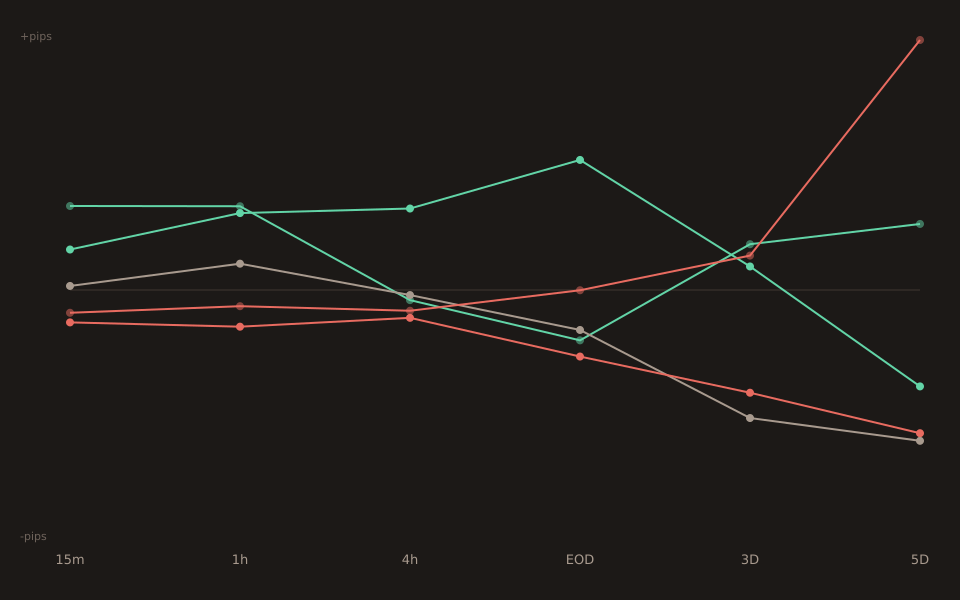
Where the beat side actually is
The saturation isn’t a rounding artifact. small_beat n=65 median −6.40p, big_beat n=11 median −4.50p. Big-beat has 4 down prints out of 11 (36.4% up-rate = 63.6% correct-direction). One of those 4 is the infamous 2020-05-29 Canada GDP Q1 2020 print (actual −7.2% MoM vs consensus −8.5%, surprise_z = +13.73by the conventional bucketing formula). That “beat” is a beat only against consensus for a catastrophic month; oil had collapsed to $20/bbl days earlier, WTI briefly went negative, and CAD was tracking oil rather than domestic macro. USDCAD didn’t fall as it “should”.
Strip that single print and big_beat is n=10 with 6 down (60% down-rate) — closer to what the miss-side monotonicity would predict for beat-side symmetry. Still not the CADJPY-sibling 90.9% up-rate on the same n=11 sample, which suggests the JPY cross has genuine amplification over the USD pair on the beat side (a pattern the ledger’s five previous JPY-cross-beats-USD-pair posts have documented on CPI, Employment, Ivey PMI, and GDP).
The full 5-bucket table
| Bucket | n | Median | Pct-up | Interpretation |
|---|---|---|---|---|
| big_miss | 24 | +16.60p | 87.5% | CAD very weak → USDCAD up (unanimous) |
| small_miss | 33 | +8.00p | 72.7% | CAD weak → USDCAD up |
| in_line | 65 | +0.80p | 50.8% | flat |
| small_beat | 65 | −6.40p | 35.4% | CAD strong → USDCAD down |
| big_beat | 11 | −4.50p | 36.4% | CAD very strong — saturation (magnitude smaller than small_beat) |
The pair-convention head-to-head with CADJPY
Read on CAD strength, both pairs tell the same story on the miss side. USDCAD big-miss = CAD weak = pair up (87.5%); CADJPY big-miss = CAD weak = pair down (73.9%). USDCAD wins on miss-side unanimity (87.5% vs 73.9%). This is the mirror of the 2026-08-19 CAD-CPI head-to-head where EURCAD won on miss side vs CADJPY.
Beat side is where they diverge sharply. USDCAD big-beat (n=11): 4 of 11 down (36.4% up-rate, 63.6% correct-direction — saturated). CADJPY big-beat (n=11, same 11 prints): 10 of 11 up (90.9% up-rate, monotonic pct-up walk). The same 2020-05-29 COVID “wrong-way” print appears in both; but on CADJPY the Q1 2020 print was the only reverser, while on USDCAD 3 additional beat-side prints also flipped (oil correlation, positioning effects, or plain USDCAD noise). Different pair, different beat-side behaviour on the same underlying event.
What the signal does past 15 minutes
The 15m saturation on the beat side is actually a 15m-window artifact — at 30m the big_beat median jumps to −11.00p, 2.4× the 15m −4.50p, restoring the monotonic descent (small_beat −5.90p, big_beat −11.00p). Miss side stays clean at 30m: medians +17.15 / +13.65 / +0.50p, pct-up 79.2 / 79.4 / 50.8%. So the “beat-side saturation” is genuinely a 15m story; by 30m the pair is doing what a monotonic 5-bucket walk should.
At 1h the beat-side saturation partially returns (small_beat −7.25p vs big_beat −3.20p), but the miss side still holds — big_miss median +16.55p, pct-up 77.3%. By 4h the miss-side signal decays: big_miss median flips to −2.00p and pct-up drops to 45.5%. Only small_miss survives cleanly to 4h at +16.10p(65.6% up-rate). USDCAD’s response to CAD GDP is a 15m-to-1h phenomenon; past that, broader macro and oil flow dominate and the release-time signal decays.
The 4h fade contrasts with 2026-08-15 CAD GDP × CADJPY’s longer-holding signal — another point where the JPY-cross-beats-USD-pair pattern shows up. The 15m→4h shape change also parallels the US CPI m/m × XAUUSD 15m→4h flip documented on 2026-08-17: a recurring feature of tail-bucket macro-release responses is that the first-15-minute reaction doesn’t match the 3-hour positioning unwind on the same release.
Verification note
All numbers verified against live /api/v1/news-impact/stats and /api/v1/news-impact/releases on 2026-08-21. The 198-release sample spans 2010 through the 2026-06-30 print. Chart generated via the standard pnpm insights:chart CLI for the 6 windows. Sixth CAD-macro-on-USDCAD post in the ledger, first with a distinct beat-side saturation story rather than a beat-side monotonic story.