AUDUSD trades Australia's Trimmed Mean CPI like a rate decision — cleanly and monotonically
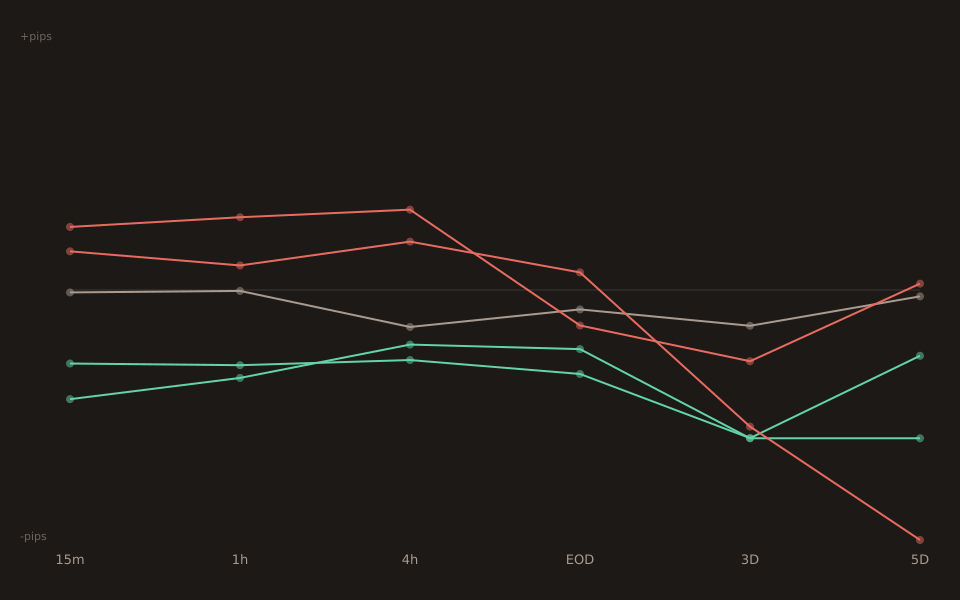
67 quarterly Trimmed Mean CPI releases since 2010, split into five surprise buckets on AUDUSD 15-minute moves. The medians line up: −36 / −24 / −1 / +21 / +13 pips. All five buckets in the right order. 0 of 5 big-miss prints and 15 of 18 small-miss prints saw the pair lower fifteen minutes later.
This is the cleanest directional shape any Australian data point produces on AUDUSD, and the reason is simple: the Trimmed Mean is the number the RBA actually uses. When the print surprises, the market re-prices the next RBA decision immediately, and it does so on the RBA’s own preferred gauge.
The bucket table
| Bucket | n | 15m median | 1h median | 4h median | Pct up (15m) |
|---|---|---|---|---|---|
| big_miss | 5 | −36.0 | −29.0 | −18.0 | 0% |
| small_miss | 18 | −24.3 | −24.8 | −23.1 | 17% |
| in_line | 25 | −0.8 | −0.3 | −12.2 | 48% |
| small_beat | 15 | +20.8 | +24.0 | +26.5 | 67% |
| big_beat | 4 | +12.8 | +8.1 | +16.0 | 75% |
Read the pct-up column. The 0% and 17% up-rates on the miss buckets are the more load-bearing number than the pip magnitudes — every one of the five big-miss prints and fifteen of the eighteen small-miss prints saw AUDUSD close lower 15 minutes after the release. Almost-unanimous directional agreement, on a data point that arrives once a quarter and is fully embedded in the RBA reaction function.
Why this event, specifically
Australia releases four distinct inflation prints (headline CPI y/y, headline CPI m/m, Trimmed Mean q/q, weighted median CPI), plus monthly ABS estimates and the various sub-components. Of those, the Trimmed Mean q/q is the one the RBA statements actually name. When the RBA writes about “inflation remaining above the 2-3% target range” or “returning to target,” the number they’re describing is the Trimmed Mean, not the headline y/y.
That means the Trimmed Mean surprise is what re-prices the OIS curve for the next RBA meeting almost immediately after the print. The AUDUSD reaction we’re measuring here is the currency translating that rates-curve re-pricing in real time: a downside surprise means the next RBA move is more likely to be a cut (or less likely to be a hike), the AUD-USD rate differential narrows, and AUDUSD falls. Miss = down; beat = up. Simple and mechanical.
The move persists through the day
The 15m → 1h → 4h columns tell the story more clearly than any single number. On small_miss (n=18), the median is −24.3p at 15 minutes and −23.1p at four hours — essentially unchanged over the trading day. On small_beat (n=15), the median actually grows from +20.8p at 15 minutes to +26.5p at four hours. Contrast this with something like UK CPI on GBPUSD (covered in a previous post), where the clean directional edge is largely gone by end of day: on Trimmed Mean AUDUSD, the direction survives.
The persistence is a hint that this is a real rate-differential re-pricing rather than a temporary liquidity-driven overshoot. Overshoots typically fade; permanent re-pricings don’t.
What this doesn’t say
The tail buckets are small. big_miss n=5 and big_beat n=4. Per Stats for Traders #3, the 95% CI on a median at n=5 is very wide — the exact −36p and +13ppoint estimates carry substantial uncertainty around their magnitude. Trust the sign (both are what you’d expect); don’t trust two decimal places of the median. The load-bearing observations are the small_miss n=18 bucket and small_beat n=15 bucket, which have credible mid-sized samples.
The small_beat median is bigger than big_beat. +20.8p vs +12.8p. This is almost certainly noise from the n=4 in big_beat; there’s no obvious economic reason a bigger beat should produce a smaller move. Treat it as “beats push AUDUSD up, and the exact magnitude-vs-surprise-size relationship on the beat side needs a few more decades of prints to pin down.”
This is the release response, not the full narrative. Between the CPI print and the next RBA meeting there are typically 6-8 weeks of additional data, RBA speeches, and offshore surprises, all of which can override the CPI move. What this post measures is the mechanical price re-pricing in the first four hours, which is the window where the CPI print is the dominant new information.
Open the tool → Free forever. No signup. No email required.