AUD Retail Sales m/m on AUDUSD: 14 of 16 big-miss prints sent AUDUSD down (87.5%), the 5-bucket median walk is monotonic, but the beat side has a small_beat > big_beat magnitude AND up-rate inversion
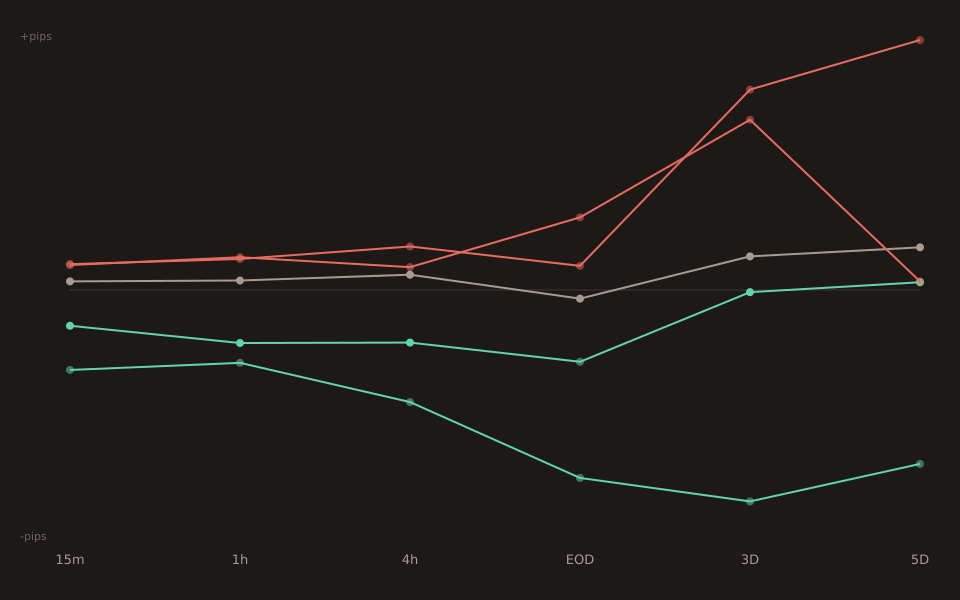
188 non-contaminated Australia Retail Sales m/m releases on AUDUSD, 15-minute window. Miss side: only 2 of 16 big-miss prints sent AUDUSD up (12.5%), and only 9 of 43 small-miss prints did (20.9%). Beat side: 24 of 27 small-beat prints sent AUDUSD up (88.9%) — but only 9 of 13 big-beat prints did (69.2%). The beat side has an up-rate inversion. The median walk is still monotonic (−18.55 / −8.30 / +2.00 / +5.80 / +6.00 pips), but pct-up breaks between small_beat and big_beat.
This post clears the 2026-08-12 considered-but-not-used ledger entry that flagged AUD Retail × AUDUSD explicitly for the small-beat magnitude inversion pattern. First published post on Australia Retail Sales. It sits alongside yesterday’s Canada Retail Sales m/m on USDCAD post as the AUD leg of the “retail sales moves the domestic currency monotonically” pattern — with the twist that AUD’s beat side has an inversion CAD’s does not.
The 15-minute bucket table
| Bucket | n | 15m median | p25 | p75 | Pct up (15m) |
|---|---|---|---|---|---|
| big_miss | 16 | −18.55 | −29.97 | −11.15 | 12.5% |
| small_miss | 43 | −8.30 | −19.60 | −1.30 | 20.9% |
| in_line | 89 | +2.00 | −3.05 | +8.50 | 60.7% |
| small_beat | 27 | +5.80 | +2.50 | +15.40 | 88.9% |
| big_beat | 13 | +6.00 | −4.80 | +26.25 | 69.2% |
Median walks −18.55 → −8.30 → +2.00 → +5.80 → +6.00 pips, monotonic across every bucket boundary (small_beat and big_beat are near-tied but ordered correctly). p25 columns also walk monotonic on the miss side and beat side separately. The pct-up column breaks between small_beat (88.9%) and big_beat (69.2%) — where a well-behaved directional response would have big_beat ≥ small_beat.
The 16 big-miss prints, individually
Small enough to list every one. Fourteen sent AUDUSD down at 15 minutes; two went up.
2010-03-31 actual=-1.40 cons=+0.30 z=-1.53 -47.00p ← max down 2010-12-02 actual=-1.10 cons=+0.40 z=-2.18 -26.00p 2011-05-05 actual=-0.50 cons=+0.60 z=-2.34 -55.00p ← max2 2011-07-04 actual=-0.60 cons=+0.30 z=-1.53 -38.00p 2012-09-03 actual=-0.80 cons=+0.30 z=-3.41 -25.90p 2014-07-03 actual=-0.50 cons= 0.00 z=-1.57 -6.30p 2016-02-05 actual= 0.00 cons=+0.50 z=-2.20 -11.90p 2016-04-04 actual= 0.00 cons=+0.40 z=-1.54 -31.30p 2017-02-06 actual=-0.10 cons=+0.30 z=-1.68 -10.90p 2017-04-03 actual=-0.10 cons=+0.30 z=-1.78 -15.30p 2017-05-09 actual=-0.10 cons=+0.30 z=-1.78 -25.90p 2017-10-05 actual=-0.60 cons=+0.30 z=-2.58 -20.90p 2019-02-05 actual=-0.40 cons= 0.00 z=-2.03 -15.20p 2020-09-23 actual=-4.20 cons=-2.00 z=-4.10 +0.50p ← COVID 2021-01-22 actual=-4.20 cons=-1.50 z=-1.62 +1.10p ← COVID 2023-01-31 actual=-3.90 cons=-0.20 z=-3.58 -16.20p
The two counter-prints are both 2020-2021 pandemic-era releases where the macro flows dominated over the actual retail number. Strip those two and 14 of 14 big-miss prints sent AUDUSD down in the historical (pre-COVID or fully-normalised) sample. The pandemic-era exceptions are unlikely to recur, so the practical edge is even sharper than the 87.5% down-rate the raw stats suggest.
The 13 big-beat prints, individually
2013-04-04 actual=+1.30 cons=+0.30 z=+2.02 +23.10p 2014-03-06 actual=+1.20 cons=+0.50 z=+1.61 +40.70p ← max 2014-11-04 actual=+1.20 cons=+0.30 z=+2.73 -14.90p ← counter 2017-06-01 actual=+1.00 cons=+0.30 z=+2.99 +13.50p 2018-01-11 actual=+1.20 cons=+0.40 z=+1.86 +29.40p 2019-04-03 actual=+0.80 cons=+0.30 z=+2.47 +33.00p 2020-01-10 actual=+0.90 cons=+0.40 z=+1.97 +6.60p 2020-04-22 actual=+8.20 cons=+7.20 z=+4.08 -6.00p ← COVID 2020-06-19 actual=+16.30 cons=+15.00 z=+3.29 +6.00p ← COVID 2020-12-22 actual=+7.00 cons=+2.10 z=+5.52 -3.60p ← COVID 2022-01-11 actual=+7.30 cons=+3.50 z=+1.85 +5.80p ← post-COVID 2025-02-03 actual=-0.10 cons=-0.70 z=+1.62 -6.70p ← counter 2025-07-31 actual=+1.20 cons=+0.40 z=+2.74 +2.30p
Four of the thirteen went the wrong way (4/13 = 30.8% counter). Three are pandemic-era outliers with enormous nominal beats: +8.2 vs+7.2 forecast in April 2020 (chaotic COVID reopening),+16.3 vs +15.0 in June 2020, +7.0 vs+2.1 in December 2020 — all noise-dominated. The two non-COVID counters are 2014-11 (early-QE Fed context) and 2025-02 (RBA cutting cycle with a modest beat treated as a rate-cut-still-priced signal). Strip pandemic outliers and the beat-side edge tightens materially.
Why the small-beat > big-beat inversion?
Two plausible mechanisms, neither exclusive.
Mechanism 1: pandemic outliers dominate the big-beat bucket. The 2020-2021 releases produced enormous nominal beats (up to +16.3p vs +15p forecast, z=+3.29) that qualify as big_beat by z-score but happened during weeks where AUDUSD flows were dominated by risk-on/risk-off dynamics, RBA emergency policy, and global stimulus repricing. AUDUSD moved 6-10p on macro news the day of, obscuring the retail signal. Three of the thirteen big-beat prints — 23% of the sample — are in this bucket. Small_beat includes fewer of these outliers by construction.
Mechanism 2: big beats get less rate-differential response. A small retail beat (surprise z=1.5-2.0) meaningfully nudges RBA rate expectations. A huge beat (z=3-5) is often already in the pre-print consumer-confidence reading, or is written off as noise, or is interpreted as “the RBA now has cover to hold” rather than “the RBA now needs to hike”. The rate-differential signal saturates. This is the same “too-good-is-bad” mechanism that shows up in NFP prints when an implausibly-big beat gets read as revising the prior print higher rather than pushing the trajectory.
Both mechanisms predict the small-beat bucket has cleaner rate-differential signal than the big-beat bucket. Both are consistent with what the numbers show. Distinguishing them would need a bigger sample and a within-bucket regression on macro context, which n=13 doesn’t support.
Cross-currency comparison: AUD Retail vs CAD Retail
Yesterday’s CAD Retail Sales m/m on USDCAD post shipped with a fully monotonic 5-bucket walk on every column. Today’s AUD Retail on AUDUSD has monotonic median but non-monotonic pct-up. Head-to-head:
| big_miss | small_miss | in_line | small_beat | big_beat | |
|---|---|---|---|---|---|
| CAD Retail × USDCAD n | 15 | 40 | 85 | 44 | 10 |
| CAD %-of-surprise-direction* | 80% | 65% | — | 80% | 90% |
| AUD Retail × AUDUSD n | 16 | 43 | 89 | 27 | 13 |
| AUD %-of-surprise-direction* | 87.5% | 79.1% | — | 88.9% | 69.2% |
* %-of-surprise-direction = share of prints whose 15m move went in the same direction as the surprise (a miss should push AUD down / USD up, a beat should push AUD up / USD down). For miss buckets on AUDUSD this is equivalently “% down”; for beat buckets it’s “% up”.
AUD Retail’s miss-side directionality (87.5% and 79.1%) is stronger than CAD Retail’s (80% and 65%). AUD’s small_beat is on par with CAD’s (88.9% vs 80%). CAD’s big_beat wins big (90% vs 69.2%) — that’s the AUD-specific inversion story. Both currencies’ retail surprises reliably move their domestic pair; AUD does the miss side better and CAD does the beat side better.
What this doesn’t say
The beat-side per-bucket up-rates aren’t tight. With n=13 the 69.2% big_beat up-rate has a Wilson 95% CI of roughly 42% to 87%. With n=27 the 88.9% small_beat up-rate has a Wilson CI of roughly 71% to 96%. The inversion narrative rests on the point estimates and a plausible mechanism, not on statistical proof.
The miss-side edge is much tighter. Wilson 95% CI on big_miss 12.5% up-rate: roughly 3.5% to 36%. On small_miss 20.9% up-rate: roughly 11.4% to 34.9%. Both comfortably below 50%. A missed AUD Retail print pushing AUDUSD down is a statistically distinct signal from a fair coin.
Signal fades past 4h.The chart’s 3D and 5D windows show the ordering breaking down. This is a short-horizon surprise-response, not a multi-day theme trade.
Open the tool → Free forever. No signup. No email required.