Paper Trail #22: A Five-Factor Asset Pricing Model (Fama & French, 2015) — the 22-years-later update to their own three-factor model, adds profitability (RMW) and investment (CMA), and finds HML redundant in U.S. data 1963-2013
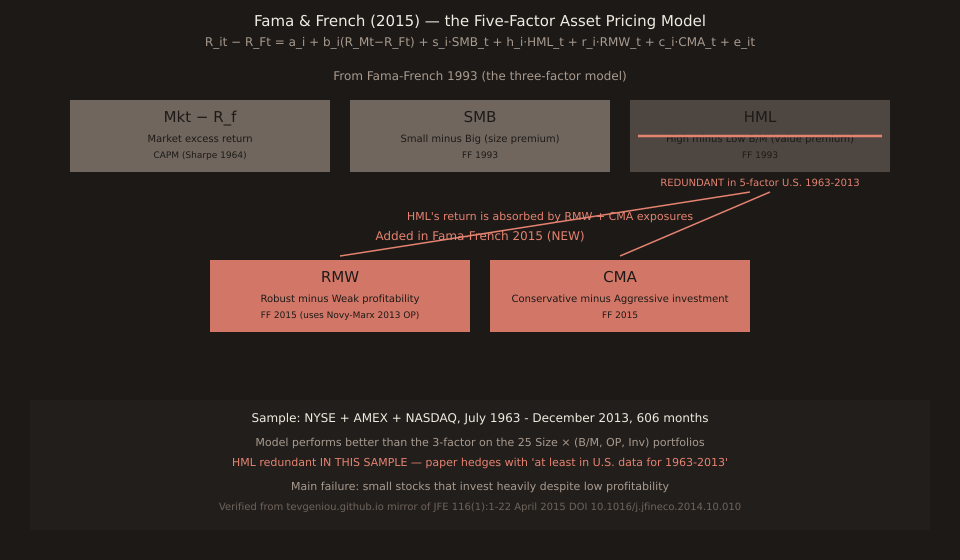
Fama and French returned to their 1993 three-factor model 22 years later, added RMW (Robust-minus-Weak profitability) and CMA (Conservative-minus-Aggressive investment), and shipped the five-factor model that now anchors most academic asset-pricing work. The most-cited finding is unexpected: in the presence of RMW and CMA, the value factor HML becomes redundant for describing average returns.
This is a direct 22-year sequel to Paper Trail #8 (Fama-French 1993) (posted 2026-08-08) and a parallel-not-competitor to Paper Trail #11 (Carhart 1997) which added momentum. FF 2015 explicitly does NOT include momentum; the two extensions of FF 1993 (four-factor with UMD vs. five-factor with RMW + CMA) are both alive and widely used.
Publication and provenance
Eugene F. Fama & Kenneth R. French (2015) “A Five-Factor Asset Pricing Model”. Journal of Financial Economics, Volume 116, Issue 1, April 2015, pages 1-22. DOI: 10.1016/j.jfineco.2014.10.010. Received 12 May 2014, revised 13 August 2014, accepted 11 September 2014, available online 29 October 2014. Fama is at the Booth School of Business, University of Chicago; French is at the Tuck School of Business, Dartmouth College (corresponding author). JEL classification G12; keywords: asset pricing model, factor model, dividend discount model, profitability, investment.
Primary source verified from the JFE PDF mirrored at tevgeniou.github.io/EquityRiskFactors/bibliography/FiveFactor.pdf (Elsevier-approved course-materials mirror, 706.7 KB, 22 pages, text-native extraction via pymupdf, 118,692 characters).
The abstract, verbatim
“A five-factor model directed at capturing the size, value, profitability, and investment patterns in average stock returns performs better than the three-factor model of Fama and French (FF, 1993). The five-factor model’s main problem is its failure to capture the low average returns on small stocks whose returns behave like those of firms that invest a lot despite low profitability. The model’s performance is not sensitive to the way its factors are defined. With the addition of profitability and investment factors, the value factor of the FF three-factor model becomes redundant for describing average returns in the sample we examine.”
The model, equation 5
R_it − R_Ft = a_i + b_i·(R_Mt − R_Ft) ← market excess (as in CAPM) + s_i·SMB_t ← size (small minus big) + h_i·HML_t ← value (high minus low B/M) — from FF 1993 + r_i·RMW_t ← profitability (robust minus weak) — NEW + c_i·CMA_t ← investment (conservative minus aggressive) — NEW + e_it
The two new factors are constructed exactly like HML in FF 1993: 2×3 double sorts on Size × OP for RMW, and Size × Inv for CMA.Robust and Weakrefer to operating profitability quintiles (revenues minus COGS minus interest minus SG&A, all over book equity — Novy-Marx’s 2013 measure). Conservative and Aggressive refer to prior-year growth in total assets. Both cutoffs use NYSE-only breakpoints applied to the full CRSP universe, standard in the FF factor literature.
The “HML is redundant” finding
Verbatim from Section 5:
“The average HML return is captured by the exposures of HML to other factors. Thus, in the five-factor model, HML is redundant for describing average returns, at least in U.S. data for 1963-2013.”
The mechanism: regress monthly HML returns on the other four factors (Mkt, SMB, RMW, CMA). The intercept is near zero and statistically indistinguishable from zero, so HML’s expected return is fully explained by its LOADINGS on those four factors. High-B/M firms tend to have specific profitability and investment profiles that RMW and CMA capture directly.
Note the careful hedge in the paper’s language: “at least in U.S. data for 1963-2013”. International samples (Fama-French 2017) and later U.S. samples haven’t always reproduced HML redundancy. The 5-factor model is a U.S. finding as of the 1963-2013 CRSP sample.
Practical: keep HML or drop it?
Fama and French take their own careful position:
“To simplify the task, we could drop the five-factor model, given that HML is redundant for describing average returns. Though captured by exposures to other factors, however, there is a large value premium in average returns that is often targeted by money managers. Thus, in evaluating investment performance, we probably want to know the exposures of LHS portfolios to the Size, B/M, OP, and Inv factors.”
Practical translation: keep HML if you’re doing style attribution (fund benchmarking, factor tilts); drop HML if you’re only building the smallest defensible asset-pricing model on U.S. 1963-2013 data. The paper also offers HMLO (equation 6) as a compromise — an orthogonalized HML that has the same regression intercept and residual as the five-factor model but preserves an interpretable value-tilt slope.
The model’s main failure
Fama and French are candid about where the model breaks:
“Small stocks with negative exposures to RMW and CMA are the biggest asset pricing problem in four of the six sets of LHS portfolios examined here. The negative CMA exposures of the troublesome portfolios always line up with evidence that the firms in these portfolios invest a lot, but negative exposures to RMW…”
In plain English: small-cap firms that invest heavily but aren’t profitablehave average returns the five-factor model over-predicts. These portfolios look like growth-trap stocks — high investment, low profitability, small capitalization — and the model tells you they should earn a certain risk premium that they systematically fail to deliver. This is the direct empirical descendant of the small-cap-distress controversies from FF 1993 discussion and Merton (1987)’s micro-cap segment analysis.
What’s the practical difference from Carhart 1997?
FF 2015 and Carhart 1997 are two DIFFERENT four/five-factor extensions of FF 1993, not sequential updates. Paper Trail #11 (Carhart 1997) added momentum (PR1YR / UMD): a factor built from the past 12 months’ return, capturing a well-documented cross-sectional return anomaly (Jegadeesh & Titman 1993, Paper Trail #2). FF 2015 adds profitability and investment — cross-sectional differences in accounting-derived firm characteristics that don’t depend on price history at all.
In practice, empirical work often uses SIX-factor models that pool both extensions: Mkt + SMB + HML + RMW + CMA + UMD. The Ken French data library website provides all six as monthly return series. Different research questions favour different subsets: if you’re studying accounting-anomaly asset pricing, FF 2015 is enough; if you’re studying cross-sectional momentum, you need UMD; if you’re doing style attribution for a fund with any past-return tilt, use all six.
Cross-links
This installment sits in a dense cluster of asset-pricing Paper Trails: PT #4 (Fama 1970 efficient markets) is the theoretical umbrella; PT #8 (FF 1993 three-factor) is the direct parent that today’s post updates; PT #11 (Carhart 1997) is the alternative four-factor extension with momentum; PT #16 (Menkhoff 2012 currency momentum) is the cross-asset extension of momentum from equities to FX.
The ledger’s queued “Fama & French (2015) five-factor update” item, flagged since PT #8 (2026-08-08, 14 days ago), is now cleared. Next queue items in the asset- pricing lineage: Asness/Moskowitz/Pedersen 2013 “Value and Momentum Everywhere” (cross-asset momentum), Sortino & Price 1994 (downside-risk framework — Sharpe → Sortino → M-squared trilogy from PT #21), and the Bollerslev-Wooldridge 1992 quasi-MLE for GARCH extension of PT #10.