UK CPI y/y on EURGBP: 12 of 13 big-miss prints sent the pair up (92.3%), the whole 5-bucket walk is monotonic on both median AND pct-up — and unlike its GBPUSD mirror, this edge doesn't fade
196 non-contaminated UK CPI y/y releases on EURGBP, 15-minute window. Medians walk +15.20 / +10.50 / −0.75 / −3.40 / −5.30 pips big_miss → big_beat — monotonic across every bucket boundary. Pct-up walks 92.3 / 87.2 / 45.6 / 26.9 / 18.8 percent — also monotonic. 12 of 13 big-miss prints sent EURGBP up. 13 of 16 big-beat prints sent it down.
Thirteen days ago I published UK CPI on GBPUSD with the story that the 15-minute directional edge is essentially gone by end of day. Today’s post is the EUR cross of the same release. It has the same 5-bucket monotonic shape at 15 minutes — but the fade does not happen. At 4 hours the EURGBP big_miss median is still +15.70p. The edge just sits there.
The 15-minute bucket table
| Bucket | n | 15m median | p25 | p75 | Pct up (15m) |
|---|---|---|---|---|---|
| big_miss | 13 | +15.20 | +9.30 | +20.10 | 92.3% |
| small_miss | 47 | +10.50 | +1.00 | +23.80 | 87.2% |
| in_line | 68 | −0.75 | −6.78 | +6.15 | 45.6% |
| small_beat | 52 | −3.40 | −9.45 | +0.95 | 26.9% |
| big_beat | 16 | −5.30 | −17.50 | −0.88 | 18.8% |
Every bucket boundary respects direction and magnitude order. The p25/p75 columns show the miss side has a wide upside-heavy IQR (big_miss [+9.3, +20.1]) and the beat side has a wide downside-heavy IQR (big_beat [−17.5, −0.88] straddles the miss zero only barely). in_line sits almost exactly at 50% as expected.
Head-to-head with GBPUSD: 13-day-old sibling
| Bucket | EURGBP med | GBPUSD med | EURGBP pct up | GBPUSD pct up |
|---|---|---|---|---|
| big_miss | +15.20 | −19.90 | 92.3% | 15.4% |
| small_miss | +10.50 | −20.50 | 87.2% | 12.8% |
| in_line | −0.75 | −0.50 | 45.6% | 50.0% |
| small_beat | −3.40 | +7.95 | 26.9% | 73.1% |
| big_beat | −5.30 | +8.45 | 18.8% | 81.2% |
Two observations. First, the miss side on GBPUSD has a small_miss magnitude that’s bigger than big_miss (−20.50 vs −19.90p — a tiny inversion). EURGBP has no such inversion: +10.50 < +15.20 lines up cleanly. Second, magnitudes on EURGBP are systematically smaller (as expected — the euro cross moves less per event than the USD cross by construction) but the pct-up direction rates on the extreme buckets are cleaner on EURGBP: 92.3% miss / 18.8% beat vs GBPUSD’s 84.6% miss / 81.2% beat (mirror-flipped). The euro cross wins on signal, the dollar cross wins on amplitude.
Why EURGBP doesn’t fade
| Window | EURGBP big_miss med | EURGBP big_beat med | GBPUSD big_miss med | GBPUSD in_line med |
|---|---|---|---|---|
| 15m | +15.20 | −5.30 | −19.90 | −0.50 |
| 30m | +14.50 | −6.10 | −23.30 | +0.95 |
| 1h | +9.40 | −8.05 | −17.20 | +2.45 |
| 4h | +15.70 | −2.85 | −15.75 | +13.40 |
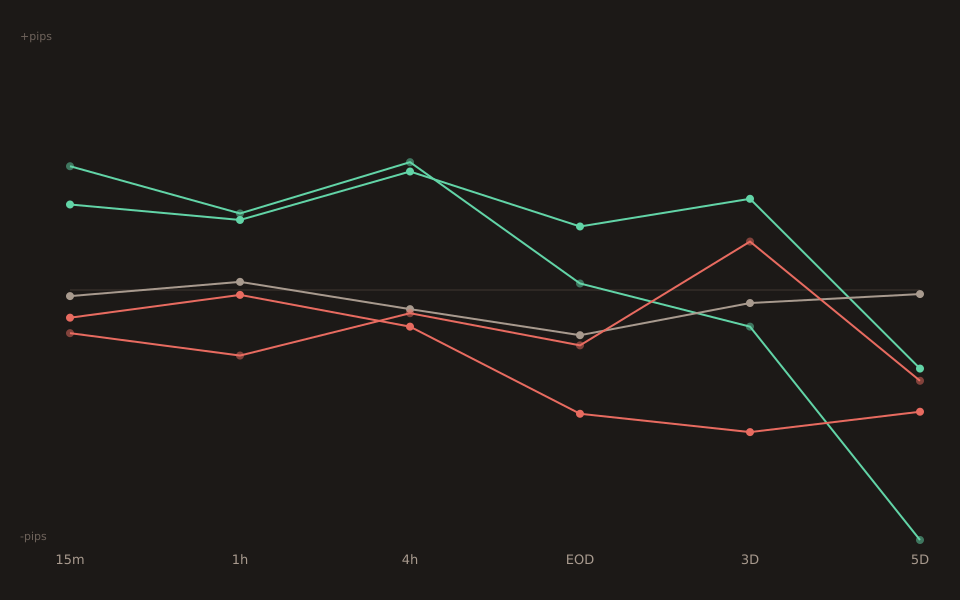
EURGBP big_miss median: +15.20 → +14.50 → +9.40 → +15.70 across the four windows. It dips at 1h then reverts to the 15m level by 4h — no fade. GBPUSD big_miss: −19.90 → −22.20 → −17.30 → −15.75 across the same windows. Directionally holds too, but note the GBPUSD in_line bucket goes from −0.50p at 15m to +13.40p at 4h — a +14p drift on the biggest bucket. That’s the whole distribution getting pushed positive over four hours as European traders step out and US traders step in. EURGBP in_line goes from −0.75 to −2.35 — negligible drift, because the pair doesn’t have a US-session handoff to absorb.
The GBPUSD 15m edge on big_miss survives the day too, in raw pips. What the 2026-08-02 fade post was really flagging is that the edge as a strategygets swamped by the +14p in_line drift by end of day, because a stop wide enough to survive that drift on the miss side is a stop that eats most of the CPI edge. EURGBP doesn’t have that problem — the same +15p miss-side edge sits on top of a flat in_line distribution.
The 13 big-miss and 16 big-beat prints, individually
With n=13 and n=16 the whole tails are listable. Miss side (long the surprise = long EURGBP) — 12 of 13 sent EURGBP up at 15 minutes:
2011-04-12 actual= 4.0 cons= 4.4 z=-2.85 +43.0p ← max 2012-07-17 actual= 2.4 cons= 2.8 z=-2.69 +2.4p 2013-11-12 actual= 2.2 cons= 2.5 z=-2.09 +21.9p 2014-06-17 actual= 1.5 cons= 1.7 z=-1.73 +17.6p 2016-05-17 actual= 0.3 cons= 0.5 z=-2.22 +3.0p 2016-11-15 actual= 0.9 cons= 1.1 z=-1.72 +17.2p 2017-07-18 actual= 2.6 cons= 2.9 z=-2.30 +30.0p 2018-07-18 actual= 2.4 cons= 2.6 z=-1.61 +10.7p 2020-01-15 actual= 1.3 cons= 1.5 z=-1.94 +15.2p 2020-12-16 actual= 0.3 cons= 0.6 z=-1.89 +9.3p 2021-03-24 actual= 0.4 cons= 0.8 z=-2.32 -2.5p ← counter 2025-03-26 actual= 2.8 cons= 3.0 z=-1.58 +9.3p 2025-12-17 actual= 3.2 cons= 3.5 z=-2.02 +20.1p
Beat side (short EURGBP) — 13 of 16 sent EURGBP down at 15 minutes:
2011-01-18 actual= 3.7 cons= 3.3 z=+2.81 -32.0p 2012-08-14 actual= 2.6 cons= 2.3 z=+1.80 -8.3p 2012-11-13 actual= 2.7 cons= 2.3 z=+2.47 -4.4p 2014-07-15 actual= 1.9 cons= 1.6 z=+2.58 -39.7p ← min 2016-04-12 actual= 0.5 cons= 0.3 z=+2.99 -20.8p 2017-06-13 actual= 2.9 cons= 2.7 z=+1.53 +4.7p ← counter 2018-09-19 actual= 2.7 cons= 2.4 z=+2.80 -24.6p 2019-08-14 actual= 2.1 cons= 1.9 z=+1.58 -6.8p 2020-02-19 actual= 1.8 cons= 1.6 z=+1.73 -16.4p 2020-07-15 actual= 0.6 cons= 0.4 z=+1.61 -1.0p 2020-08-19 actual= 1.0 cons= 0.6 z=+2.90 -6.2p 2022-08-17 actual=10.1 cons= 9.8 z=+1.52 +1.8p ← counter 2022-11-16 actual=11.1 cons=10.7 z=+2.66 +28.7p ← counter (2022 UK-fiscal turmoil) 2023-03-22 actual=10.4 cons= 9.9 z=+2.48 -4.1p 2023-05-24 actual= 8.7 cons= 8.2 z=+2.12 -2.8p 2025-02-19 actual= 3.0 cons= 2.8 z=+1.72 -0.5p
The one big-miss counter (2021-03-24 −2.5p) is a small negative on the biggest z-surprise in the miss sample — COVID-era, plausibly noise. The three big-beat counters are 2017-06-13 (+4.7p on a modest z=+1.53), 2022-08-17 (+1.8p, near-zero), and 2022-11-16 (+28.7p, the standout). That November 2022 print landed a month after Liz Truss’s mini-budget collapse and mid-Sunak, when sterling was carrying an idiosyncratic UK-fiscal-turmoil premium that inverted the normal inflation reaction. Drop that one print and big_beat becomes 12 of 15 down = 80.0% (from 13 of 16 = 81.2%) — the story is not driven by that outlier.
What this doesn’t say
n=13 and n=16 are small. The 92.3% and 81.2% dominance rates carry Wilson 95% CIs of roughly (66%, 99%) and (57%, 93%). Both exclude 50%, but the point estimates carry real uncertainty. Per Stats for Traders #3 an n=13 median CI (distribution-free) is roughly ±13p wide around a +15.2p median.
The 2022-11-16 outlier is real, not a data error. UK Oct 2022 CPI printed 11.1% vs 10.7% consensus (an actual peak of the UK inflation cycle) and EURGBP moved +28.7p at 15 minutes. That’s against the usual inflation-beat = sterling-strong = EURGBP-down template. The context — the pound was in the middle of the post-Truss fiscal-credibility repair — matters. Any big beat that lands during a UK-idiosyncratic-shock regime is going to trade backwards, and the template applies to the median print not the individual one.
UK CPI releases at 07:00 UTC, pre-London-open. The initial 15-minute reaction is being priced in a thin book. Fills at the real bid-ask on a live account will be materially worse than the median-move-pips number suggests. The p25/p75 numbers give a more realistic sense of range than the median.
Open the tool → Free forever. No signup. No email required.