Paper Trail #11: On Persistence in Mutual Fund Performance (Carhart, 1997) — the paper that added momentum to Fama-French and killed most of the 'hot hands' persistence story
Carhart (1997) extends the Fama-French 1993 3-factor model by adding a fourth factor — PR1YR, a zero-investment portfolio long last year’s top-30% return firms and short last year’s bottom-30%. On a survivor-bias-free sample of 1,892 diversified US equity mutual funds from 1962-1993, the resulting 4-factor model plus investment costs explain 6.3 of the 8 percentage pointsof annual return spread between decile-1 and decile-10 past-return funds. What remains of the “hot hands” persistence story is a thin residual concentrated in the bottom decile.
This is the direct sequel to two earlier Paper Trail posts. It packages the Jegadeesh & Titman 1993 momentum result as a fourth factor to add to Fama & French’s 3-factor model, then applies the combined model to a big mutual-fund data set to explain what had been thought of as manager skill.
The paper, in one sentence
“Using a sample free of survivor bias, I demonstrate that common factors in stock returns and investment expenses almost completely explain persistence in equity mutual funds’ mean and risk-adjusted returns. Hendricks, Patel and Zeckhauser’s (1993) ‘hot hands’ result is mostly driven by the one-year momentum effect of Jegadeesh and Titman (1993), but individual funds do not earn higher returns from following the momentum strategy in stocks. The only significant persistence not explained is concentrated in strong underperformance by the worst-return mutual funds. The results do not support the existence of skilled or informed mutual fund portfolio managers.” That’s the abstract from page 57, verbatim.
The 4-factor model (Equation 3, page 61)
r_it = α_i + b_iM · RMRF_t + s_iM · SMB_t + h_iM · HML_t + p_iM · PR1YR_t + e_it where: r_it = fund i excess return over 1-mo T-bill, month t RMRF = excess return on CRSP value-weight market proxy SMB = "small minus big" (size) factor (Fama-French) HML = "high minus low" BE/ME (value) factor (Fama-French) PR1YR = "prior 1-year momentum" factor (Carhart's addition)
The first three regressors — RMRF, SMB, and HML — are the same as Fama-French 1993. The fourth, PR1YR, is Carhart’s. Footnote 3 on page 61 defines it verbatim: “equal-weight average of firms with the highest 30 percent eleven-month returns lagged one month minus the equal-weight average of firms with the lowest 30 percent eleven-month returns lagged one month. The portfolios include all NYSE, Amex, and Nasdaq stocks and are re-formed monthly.” The 11-month window skipping the most recent month is deliberate — it avoids the short-term reversal effect that would contaminate a 12-month-lagged-0 construction.
Table II — Factor summary stats, July 1963 – December 1993
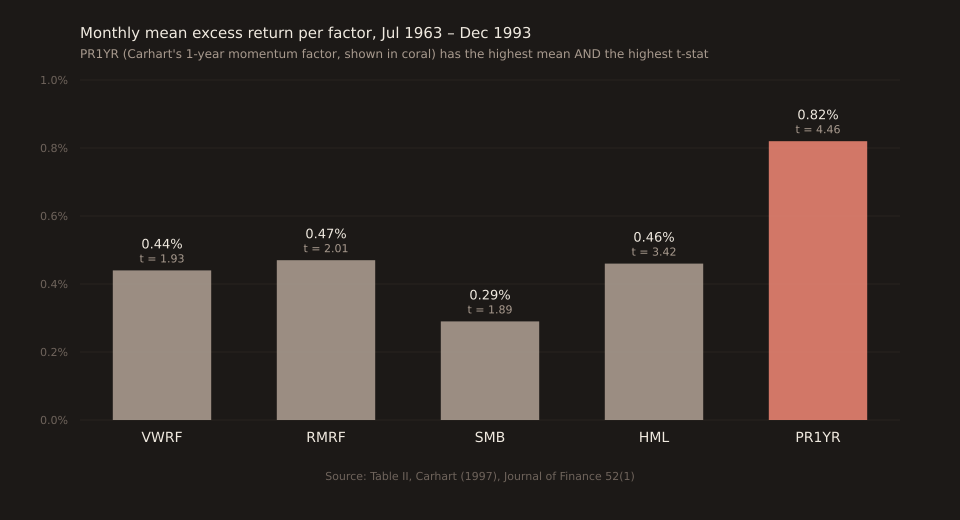
PR1YR has both the highest monthly mean excess return (0.82%) and the highest t-statistic (4.46) of the five factors. Its correlations with the other factors (also from Table II) are: with VWRF +0.01, with SMB −0.29, with HML −0.16. Low cross-correlations mean the four-factor model shouldn’t suffer from multicollinearity — which the paper confirms by showing the 4-factor mean absolute pricing error on 27 test portfolios is 0.14%/month, vs 0.31% for 3-factor and 0.35% for the CAPM.
The main result — Table III, page 64-65
Sort mutual funds annually into decile portfolios by prior 1-year return, equal-weight, re-form each January 1. Post-formation monthly excess returns:
| Decile | Monthly excess | CAPM alpha | 4-factor alpha | Note |
|---|---|---|---|---|
| 1A (top 3.3%) | +0.75% | +0.27% | −0.11% | 14 funds/yr avg |
| 1 (top decile) | +0.68% | +0.22% (t=2.10) | −0.12% (t=−1.60) | CAPM α positive; 4-factor α near zero |
| 2-8 (middle) | ~+0.34% to +0.59% | ~0% | ~−0.15% | All roughly one-for-one their expenses |
| 9 | +0.23% | −0.21% | −0.20% | t = −3.11 on 4-factor α |
| 10 (bottom) | +0.01% | −0.45% (t=−4.58) | −0.40% (t=−4.33) | Both models flag persistent underperformance |
| 10C (bottom 3.3%) | −0.25% | −0.74% | −0.64% (t=−4.49) | Bottom 3.3% of funds by prior-year return |
The decile 1 minus decile 10 raw spread is 0.67% per month ≈ 8% per year. The CAPM alpha spread is nearly identical (0.67%), because CAPM betas on the deciles are all near 1.0 — so CAPM leaves the entire spread unexplained. The 4-factor alpha spread drops to 0.29% per month ≈ 3.5% per year. Most of that residual comes from the decile-9-to-decile-10 gap (0.20% per month), which the paper interprets as genuine bottom-fund persistent underperformance, not top-fund persistent skill.
The three cost effects
Table V (page 66) reports Fama-MacBeth cross-sectional regressions across 330 monthly windows, averaging 350 fund observations each (~116,000 fund-month observations total). Coefficients × 100:
Expense ratio (t): −1.54 (t = −5.99) *** significant Turnover (Mturn, t): −0.95 (t = −2.36) * significant Max load fee (t-1): −0.11 (t = −3.55) *** significant ln TNA (t-1): −0.05 (t = −0.66) not significant Buy turnover (t): −0.43 (t = −1.16) not significant Sell turnover (t): −1.26 (t = −3.00) * significant
Three findings from this table are the most-cited: (1) expenses hit performance more than one-for-one — a coefficient of −1.54 means 100 bp of expense ratio costs 154 bp of annual abnormal return; (2) turnover implies transaction costs of about 95 bp per round-trip transaction; (3) sell-side turnover matters much more than buy-side (a pre-cursor observation to the modern impact-cost literature).
The decomposition of the 8% spread
Section III’s summary decomposition, verbatim from page 74 with numbers verified against the Figure 3 accompanying text: “The net gain in returns from buying the decile of past winners and selling the decile of losers is 8 percent per year. I explain 4.6 percent with size, book-to-market and one-year momentum in stock returns; 0.7 percent with expense ratios; and 1 percent with transaction costs.”
- 4.6 pp from 4-factor exposure (mostly PR1YR and SMB)
- 0.7 pp from expense-ratio differences (top funds have modestly lower expense ratios)
- 1.0 pp from transaction-cost differences
- 1.7 pp residual, of which two-thirds is concentrated in the decile 9 vs decile 10 gap
The residual sits almost entirely in the bottom decile — the “top managers are skilled” story evaporates once you control for factor exposure and costs. Only the “bottom managers are persistently bad” story survives.
Practical rules of thumb (page 80)
Carhart’s conclusion offers three rules of thumb for “wealth-maximizing mutual fund investors”:
- Avoid funds with persistently poor performance. The residual anomaly in the data is bottom-decile underperformance, not top-decile outperformance.
- Funds with high past-year returns have higher expected returns next year — but not in years thereafter. The momentum-driven persistence lasts about 12 months, not multi-year.
- All investment costs — expense ratios, transaction costs, and load fees — have a direct, negative impact on performance. The average load fund underperforms the average no-load fund by roughly 80 bp/year after controlling for expenses.
Why this matters for the tool
Carhart’s findings connect to the News Impact Explorer at two levels. First, at the strategy level: any “ trade-the-surprise” approach must beat a passive benchmark AFTER transaction costs. Carhart’s 95-bp round-trip cost estimate on 1960s-1990s US equities is a floor; today’s FX markets are cheaper (1-2 bp spread on liquid pairs at institutional tier, 3-8 bp at retail) but not zero. The bucket-median moves in the tool are pre-cost gross figures.
Second, at the model level: Carhart shows that apparent “skill” in mutual funds is mostly factor loadings. The analog for a surprise-based FX strategy is: if a (event, pair) big-beat rule produces a per-print Sharpe of 1.5, is that Sharpe truly incremental, or is it being explained by a common factor like “risk-on momentum” that would show up in a portfolio of unrelated risk-on trades too? The rigorous answer is a Carhart-style multi-factor regression against candidate FX factors (carry, momentum, value, vol) before crediting the strategy with edge.
Verification and reproducibility
The PDF I OCR’d is a JSTOR reprint hosted at finance.martinsewell.com/fund-performance/Carhart1997.pdf. The JSTOR original at links.jstor.org/sici?sici=0022-1082%28199703%2952%3A1%3C57%3AOPIMFP%3E2.0.CO%3B2-G requires a subscription; the reprint is a 27-page image-only PDF (JSTOR’s standard scan format for 1990s issues), so pymupdf’s normal text extraction returned empty and I ran tesseract-ocr instead (dpi=200, language=eng, full=true), which recovered 77,245 characters. I cross-verified quantitative claims (Table II, Table III, Table V, and the conclusion’s decomposition text) against the OCR output; the model equation is from page 61, the decomposition from page 74. Original DOI: 10.1111/j.1540-6261.1997.tb03808.x. Also available via SSRN abstract ID 8036 (author’s SSRN listing).
Ledger’s queue item on Carhart 1997 (added to the queue 2026-08-08 alongside FF15 and other FF-lineage follow-ups) is now marked as published; Fama & French (2015) five-factor update remains queued as the natural next FF-lineage installment (better spaced 2+ weeks from today’s Carhart post so it doesn’t feel like piled-on Fama-French).