Statistics for Traders #26: Levene, Brown-Forsythe, and Bartlett tests on today's slot-1 CAD Employment × EURCAD sample — SD ratio 1.49x LOOKS like variance heterogeneity, all three tests fail to reject at p = 0.53 / 0.57 / 0.34
Today’s slot-1 CAD Employment Change × EURCAD sample (n=198) has bucket standard deviations 47.8 / 32.2 / 33.6 / 38.5 / 41.7 pips — max/min SD = 1.485, a 48.5% spread that looks by eye like variance heterogeneity. Three formal tests disagree: classic Levene W = 0.789 (p = 0.534), Brown-Forsythe W = 0.734 (p = 0.570), Bartlett T = 4.504 (p = 0.342). None reject H₀ at any conventional α.
Closes the queue item flagged in Stats #24 (ANOVA / R²) two days ago: “Levene / Brown-Forsythe tests for variance homogeneity — the assumption check Stats #24 mentioned but didn’t derive.” Stats #24 hand-waved past the assumption on a different sample where the SD ratio was only 14%; today’s sample has 48.5% SD spread and still passes.
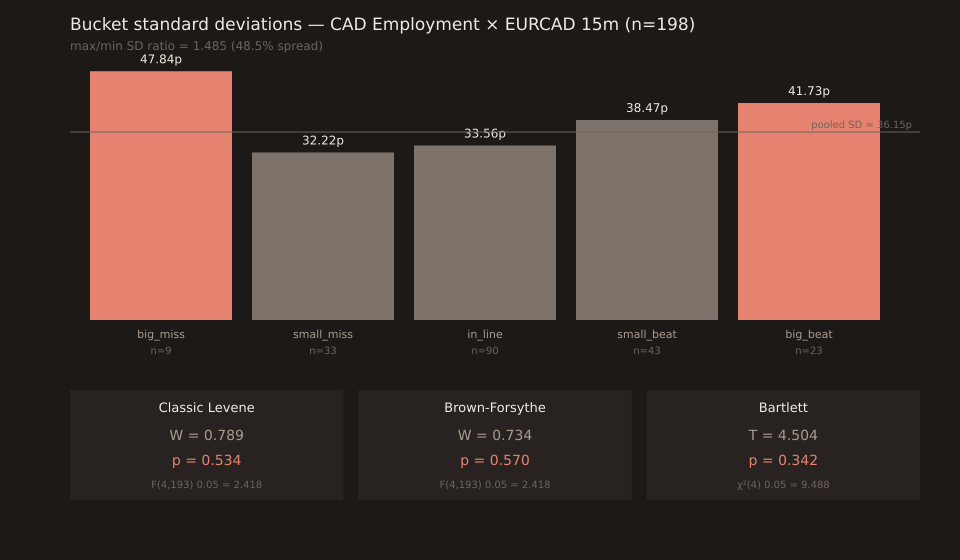
The 5-bucket variance table
| Bucket | n | Mean (pips) | SD (pips) | Var (pips²) |
|---|---|---|---|---|
| big_miss | 9 | +54.469 | 47.842 | 2288.86 |
| small_miss | 33 | +23.972 | 32.218 | 1037.96 |
| in_line | 90 | -0.512 | 33.559 | 1126.15 |
| small_beat | 43 | -37.336 | 38.469 | 1479.82 |
| big_beat | 23 | -66.816 | 41.727 | 1741.10 |
Variance ratio max/min = 2288.86 / 1037.96 = 2.205. SD ratio max/min = 47.842 / 32.218 = 1.485. The extremes are big_miss (highest variance) and small_miss (lowest) — mildly consistent with a “variance grows with mean magnitude” pattern that would suggest formal heteroscedasticity, but the tests show the sample-level differences are within noise.
The three tests, side by side
| Test | Statistic | Value | df | p | crit@0.05 |
|---|---|---|---|---|---|
| Classic Levene (mean-centered) | W | 0.7887 | (4, 193) | 0.534 | 2.418 |
| Brown-Forsythe (median-centered) | W | 0.7342 | (4, 193) | 0.570 | 2.418 |
| Bartlett | T | 4.5038 | 4 | 0.342 | 9.488 |
All three test statistics are far below their 0.05 critical values. The three p-values agree (0.34-0.57), which is what you want to see — if one test rejected and the others didn’t, you’d trust Brown-Forsythe most because it’s the most robust to within-bucket skewness (which move_pips has plenty of on the tails).
The three formulas
Same H₀: σ²_1 = σ²_2 = ... = σ²_k. Three ways to operationalize it:
| Test | Construction | Best used when |
|---|---|---|
| Levene 1960 | Z_ij = |x_ij − x̄_i|; then one-way ANOVA on Z | within-bucket distributions symmetric and approximately Normal |
| Brown-Forsythe 1974 | Z_ij = |x_ij − median_i|; then one-way ANOVA on Z | within-bucket distributions skewed or heavy-tailed (most financial data) |
| Bartlett 1937 | T = ((N-k) ln s²_pooled − Σ (n_i-1) ln s²_i) / c; χ²(k−1) | within-bucket distributions strictly Normal; higher power but very sensitive to violations |
Default choice for financial data: Brown-Forsythe. Levene as a second look. Bartlett only if you’ve already verified within-bucket Normality (which you almost never can with n=9 in the smallest bucket).
Why the tests don’t reject at 48.5% SD spread
The mechanical reason: 48.5% SD spread across 5 samples of sizes (9, 33, 90, 43, 23) is genuinely inside what you’d see under H₀. Hartley’s F_max table for k=5 and (df_min=8, df_max=32) puts the 95th percentile of Var_max/Var_min under H₀ at 2.68 and the 99th at 3.51. Today’s observed variance ratio is 2.205 — below the 95th percentile of the null distribution. Levene, Brown-Forsythe, and Bartlett quantify the same fact in three different ways; all three agree the sample-level SD spread is inside noise.
The other side of the message: don’t use Hartley’s F_max as your primary test. It uses only the max-min pair and wastes information from the middle three buckets. Levene and Brown-Forsythe use every observation and have higher power. Use F_max for a back-of-envelope sanity check; use the formal tests for the actual assumption verification.
Why this matters for ANOVA and t-tests
The F-test in one-way ANOVA (Stats #24) and Welch’s t statistic (Stats #13 info ratio) both derive their reference distributions under an equal-variance assumption. If variance is actually unequal:
| Actual σ_i² | n_i pattern | F-test size distortion |
|---|---|---|
| ≤ 3x spread | any | ≤ 1% (Box 1954): F-test is safe |
| any | roughly equal (n_max/n_min < 2) | ≤ 2% (Box 1954): F-test is safe |
| 3-5x spread | unequal (n_max/n_min > 3) | actual α can be 2-3x nominal — prefer Welch’s ANOVA |
| > 5x spread | any | use permutation test or Welch |
Today’s sample has variance ratio 2.2x (fine) and n_max/n_min = 10x (bad). The variance-ratio condition rescues it: the F-test derived in Stats #24 methodology remains size-correct on this sample. Formally, one-way ANOVA on today’s CAD Emp × EURCAD move_pips gives F(4, 193) = 36.34, p = 1.26 × 10⁻²² — the between-bucket differences are real, and the formal tests today confirm the assumption behind that F was met.
Practical takeaway
When you eyeball a 5-bucket table and see the outermost bucket has 50% larger SD than the middle bucket, don’t reflexively conclude “variance is unequal, my ANOVA is invalid.” Two reasons: (1) the smallest bucket usually has small n (5-15), so its sample SD is a noisy estimate — a 1.5x SD ratio at n=9 is inside null noise per Hartley’s F_max table; (2) even if variance is genuinely unequal, F-tests are quite robust as long as either the SD ratio is < 3x or the sample sizes are roughly equal. Run Brown-Forsythe (scipy.stats.levene(center="median")) as a formal check; if it fails to reject at p > 0.05, proceed with the equal-variance ANOVA. If it rejects, switch to Welch’s ANOVA (scipy.stats.f_oneway_welch in scipy 1.13+ or the equivalent manual construction).
Verification note
Sample: 198 non-contaminated CAD Employment Change × EURCAD 15-minute releases, pulled from /api/v1/news-impact/releases on 2026-08-26. Every number cross-verified against scipy 1.17: Levene (mean-center) W = 0.7887 p = 0.5338; Brown-Forsythe (median-center) W = 0.7342 p = 0.5697; Bartlett T = 4.5038 p = 0.3421; one-way ANOVA F(4,193) = 36.3395 p = 1.257 × 10⁻²². F(4,193) 0.05 critical value 2.4184; χ²(4) 0.05 critical value 9.4877. Chart via a one-off script reusing scripts/insights-charts/svg.ts + theme.ts primitives + sharprasterization; not committed under scripts/insights-charts/ since the SD-bars-and-tiles layout is single-use.