Statistics for Traders #21: Tukey-Hanning kernel n_eff = 106 on the same 196-release NFP × USDJPY sample — closes the six-method kernel-family arc, with the PSD-by-construction guarantee that doesn't quite hold
Sixth and final kernel-family installment on the same 196-release NFP × USDJPY 15m |move_pips| series Stats #10 diagnosed and Stats #20 Parzen was the previous leg on. Today: Tukey-Hanning kernel with Andrews-1991 AR(1) plug-in bandwidth. Same q=2 order as QS and Parzen, same a-value 0.9029 as both — the entire n_eff difference across the trio comes from the bandwidth constant (1.7462 for TH, 1.3221 for QS, 2.6614 for Parzen).
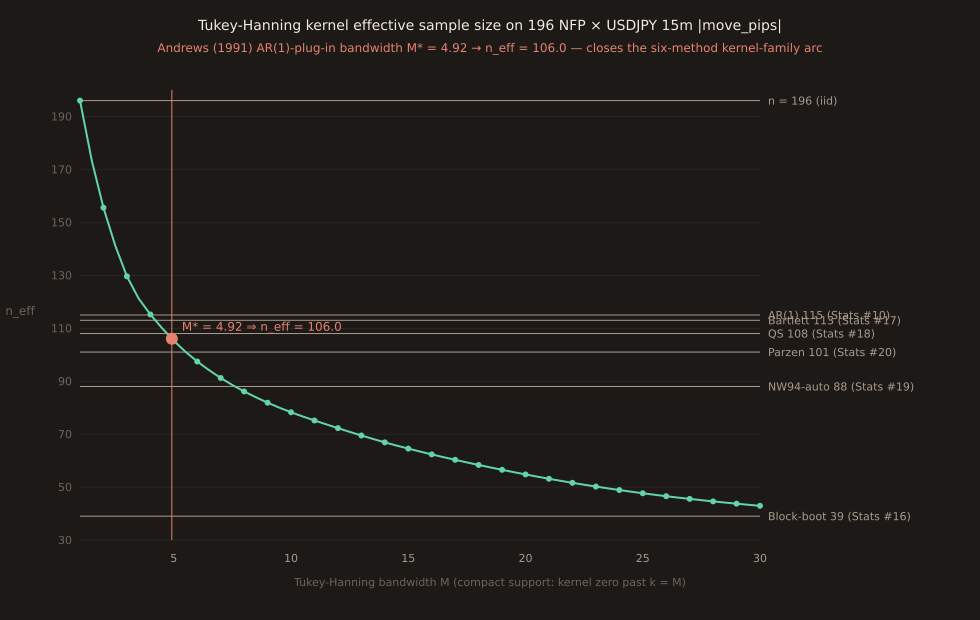
Tukey-Hanning n_eff = 106.02 at M* = 4.92 on this sample. Sits between QS (108) and Parzen (101) in the six-method kernel-family arc. Closes the ledger’s queued Tukey-Hanning item.
The Tukey-Hanning kernel
Andrews 1991 Table 1 formula, verbatim:
K(u) = (1 + cos(π·u)) / 2 for |u| ≤ 1 K(u) = 0 otherwise
A smooth cosine bell from K(0) = 1 to K(1) = 0. Compact support like Parzen (cuts off cleanly at |u|=1). Order q=2 like QS and Parzen. Named after Tukey and Hanning who used it for spectral estimation in the 1960s — signal-processing texts call it the “Hann window”.
Andrews 1991 bandwidth for TH
Because TH is order q=2, the AR(1)-plug-in a-formula is the same as Parzen and QS from Stats #20 and Stats #18:
a(2) = 4·ρ² / (1-ρ)⁴ (Andrews eq 5.3) = 4·(0.2601)² / (1-0.2601)⁴ = 4·0.06765 / 0.29996 = 0.9029 (IDENTICAL to Stats #18 QS and Stats #20 Parzen — same q, same ρ(1)) M*(TH) = 1.7462 · (a·T)^(1/5) (Andrews eq 5.9) = 1.7462 · (0.9029 · 196)^(1/5) = 1.7462 · 176.97^(1/5) = 1.7462 · 2.8158 = 4.917
The Andrews constant table (eq 5.9 / 7.2 of the 1991 paper): Bartlett 1.1447, Parzen 2.6614, Tukey-Hanning 1.7462, QS 1.3221. TH sits between QS and Parzen on this list, so its M* sits between QS’s and Parzen’s (4.92 vs 3.72 vs 7.49).
The τ_int calculation
Tukey-Hanning kernel weights at M* = 4.92:
K(1/4.92) = K(0.2034) = (1 + cos(0.639))/2 = 0.9014 ρ(1) = 0.2601 K(2/4.92) = K(0.4068) = (1 + cos(1.278))/2 = 0.6443 ρ(2) = 0.2441 K(3/4.92) = K(0.6102) = (1 + cos(1.917))/2 = 0.3304 ρ(3) = 0.0452 K(4/4.92) = K(0.8136) = (1 + cos(2.556))/2 = 0.0833 ρ(4) = 0.2120 K(≥5/4.92) = 0 (compact-support cutoff) τ_int(M*) = 1 + 2·Σ_{k=1..4} K(k/M*)·ρ(k) = 1 + 2·(0.9014·0.2601 + 0.6443·0.2441 + 0.3304·0.0452 + 0.0833·0.2120) = 1 + 2·(0.2345 + 0.1573 + 0.0149 + 0.0177) = 1 + 2·0.4244 = 1.8487 n_eff = T / τ_int = 196 / 1.8487 = 106.02
Compare with Stats #18 QS at n_eff = 108 (M* = 3.72, τ_int = 1.82): TH catches slightly more of ρ(2) (0.2441 with weight 0.6443 vs QS’s ~0.5) and ρ(4) (weight 0.0833 vs QS’s ~0 past |u|=1). Compare with Stats #20 Parzen at n_eff = 101 (M* = 7.49, τ_int = 1.95): Parzen’s wider bandwidth catches ρ(4) with weight 0.20, ρ(5) with 0.07, ρ(6) with 0.02, ρ(7) with 0.001 — so it aggregates more autocorrelation past k=4 than TH does. TH lands in the middle: aggregates through ρ(4), zeros out past ρ(5).
The full six-kernel arc
| Method | Installment | Bandwidth | τ_int | n_eff |
|---|---|---|---|---|
| IID | Stats #10 opening | — | 1.000 | 196 |
| AR(1) parametric | Stats #10 | — | 1.703 | 115 |
| Bartlett Andrews-1991 | Stats #17 | M* = 4.51 | 1.740 | 113 |
| QS Andrews-1991 | Stats #18 | S* = 3.72 | 1.822 | 108 |
| Tukey-Hanning Andrews-1991 | today | M* = 4.92 | 1.849 | 106 |
| Parzen Andrews-1991 | Stats #20 | M* = 7.49 | 1.945 | 101 |
| Bartlett NW94-auto | Stats #19 | m = 8 | 2.221 | 88 |
| Block bootstrap Politis-White | Stats #16 | b_opt = 4.98 | — | 39 |
The six HAC estimators (rows 3-7) cluster in the 88-113 range; AR(1) parametric sits at 115; the block bootstrap sits at 39 because it corrects the whole sampling distribution rather than just variance-of-the-mean. On this sample the specific-kernel choice within the HAC family swings n_eff by ~25 units (113 - 88); the parametric-vs-non-parametric split swings it by ~1 unit (115 - 113); the variance-vs-whole-distribution split swings it by ~50-70 (108 - 39). Which one you care about depends on which question you’re asking of the mean.
The one thing TH does differently: not PSD-by-construction
Andrews Section 2 flags Tukey-Hanning as not positive-semi-definite by construction — its spectral window (Fourier transform of the kernel) has small negative side-lobes past |u|=1. In principle that means you can construct a sample where the HAC variance estimate using TH comes out negative, which is a real problem for a variance-of-the-mean estimator.
On this sample, the PSD issue doesn’t bite. τ_int(M) is positive at every bandwidth from M=1 (τ=1.00) through M=30 (τ=4.57) — every value tested lands well clear of zero. Why: our ρ(1..4) are all positive (0.26, 0.24, 0.05, 0.21) and TH’s mainlobe weights are all positive too, so their product stays positive and the sum grows monotonically with M.
You’d need a sample with alternating-sign lag-1..lag-N autocorrelations to construct a case where TH’s negative side-lobes cause τ_int to underflow. That kind of series happens in MA(1) processes with a negative moving-average parameter, or in badly-differenced time series — neither describes our NFP × USDJPY |move_pips| data. So the “not PSD” warning is a robustness note, not an active problem here. In contrast, Bartlett, Parzen, and QS are all PSD-by-construction: Bartlett via the Fejer-kernel spectral form, Parzen via the squared-Fejer form, QS by direct spectral-density derivation.
What’s left in this series
The kernel-family n_eff arc closes with today’s post. The ledger’s queue for this series now shifts to different threads: higher-order VAR-b prewhitening (Andrews-Monahan-style with b ≥ 2, extending Paper Trail #20’s AR(1)-prewhitening leg to VAR(4) or VAR(11)), running- window b_opt (rolling stationarity check on Stats #16’s block length), Fisher r-to-z transformation (Stats #11 introduced it in passing; a full worked derivation is queued), and partial correlation (Pearson r controlling for a third variable, natural Stats #11 extension). None of those continues the kernel-family thread — that thread is done.
Verification note
Implementation: scripts/insights-charts/tukeyHanningNeff.ts, cross-verified against Python numpy to 4 decimal places (no random component — deterministic arithmetic). Kernel form and Andrews-1991 constant traced to Table 1 and equation 5.9 of the 1991 Econometrica paper (Cowles Foundation Discussion Paper 877 working-paper precursor, verified 2026-08-17 for Paper Trail #17). Same 196-release sample as Stats #10, #15, #16, #17, #18, #19, and #20 — first release 2010-05-07, last 2026-06-06, MQL5:US_NFP_CHANGE × USDJPY, non_contaminated population, 15m window.