Paper Trail #15: An Empirical Evaluation of Accounting Income Numbers (Ball & Brown, 1968) — the paper that showed annual earnings correlate with stock returns AND that price starts moving on the news months before the release
Ball & Brown’s 1968 JAR paper. Volume 6, issue 2, pages 159-178. The first paper to show that annual accounting earnings do carry price-relevant information — and that the market already has most of that information (85-90%per B&B’s own p.176 estimate) by the time the annual report drops. The remaining 10-15% shows up as an abnormal return around the announcement andkeeps drifting in the surprise direction for months afterward. That drift is the phenomenon Bernard & Thomas 1989 (Paper Trail #6) would name post-earnings-announcement drift.
Verification caveat.The primary 1968 Journal of Accounting Research paper is behind JSTOR’s paywall (WebFetch on 2026-08-15 returned an error page with no article content). The Chicago Booth-hosted PDF returned HTTP 404; Springer’s replication-study PDF redirected to an authentication gateway; Academia.edu returned HTTP 403. Every claim below traces to one of three open-access secondary sources, verified today:
- Williams, Zach (2019)“A Reexamination of Ball and Brown”. Journal of Management and Innovation 5(2), Fall 2019. PDF from jmi.mercy.edu, extracted with pymupdf (54,078 characters).
- Gow, Ian D. “Empirical Research in Accounting: Tools and Methods” — open-source textbook, chapter 11 (bb68.html) hosted at iangow.github.io/far_book. Provides verbatim quotes from the 1968 paper.
- Wikipedia“Post-earnings-announcement drift” article. Cited for the “first documented PEAD” attribution and the broader PEAD-lineage context.
NOT verified from primary source today: the widely-cited 261 firms / 2,349 firm-year observation counts (consistent with the sample description but not directly confirmed), the exact Figure 1 API values at specific month indices, and the exact Table 5 numbers. This is the same verification-caveat pattern as #5 (Engle 1982), #6 (Bernard & Thomas 1989), and #14 (Politis-Romano 1994).
What the paper set out to answer
Ball & Brown were writing at a moment when the received view among finance academics was that accounting statements didn’t matter for stock prices. Per Kothari’s 2001 survey (cited by Williams 2019), “before the work of Ball and Brown, investors felt that accounting statements had minimal value” — the thinking was that financial statements were the subjective product of the preparer’s discretion, and investors had access to more timely information channels (analyst reports, industry data, interim disclosures) that made the once-a-year annual report stale by the time it landed.
B&B’s empirical question: is that actually true? Or does the annual earnings number contain information the market hasn’t already priced in? Their design was an event study — the same class of analysis Fama-Fisher-Jensen-Roll pioneered on stock splits in 1969 — but applied to earnings announcements.
Sample and methodology
Per Williams (2019): the sample is firms with fiscal years ending December 31st, listed on the NYSE, over the period 1957-1965. Price movement was examined “in the period one year prior to the earnings announcement through six months post”. Widely-cited figures put the sample at 261 firms and roughly 2,349firm-year observations, though I’m not able to verify those against the 1968 paper directly today.
Per Gow’s textbook: B&B used two expected-earnings models to classify firms into good-news vs bad-news portfolios:
- Naive random-walk model.Expected earnings this year = last year’s earnings. Surprise = the year-over-year change.
- Market model regression.Estimate a linear relationship between firm earnings changes and market-wide earnings changes on historical data. Apply the contemporaneous market change to predict the firm’s expected earnings; the surprise is the regression residual. This is the equivalent for earnings of what Sharpe-Lintner-Fama-Jensen-Fisher-Roll were doing for returns.
Both approaches produce a binary sign for each firm-year (good or bad news). The abnormal return around the announcement is then tracked as the Abnormal Performance Index (API) — a cumulative buy-and-hold measure of excess return over a market benchmark starting some months before the release.
The three principal findings
Per Ball & Brown’s 2019 retrospective (as recounted in Gow’s textbook):
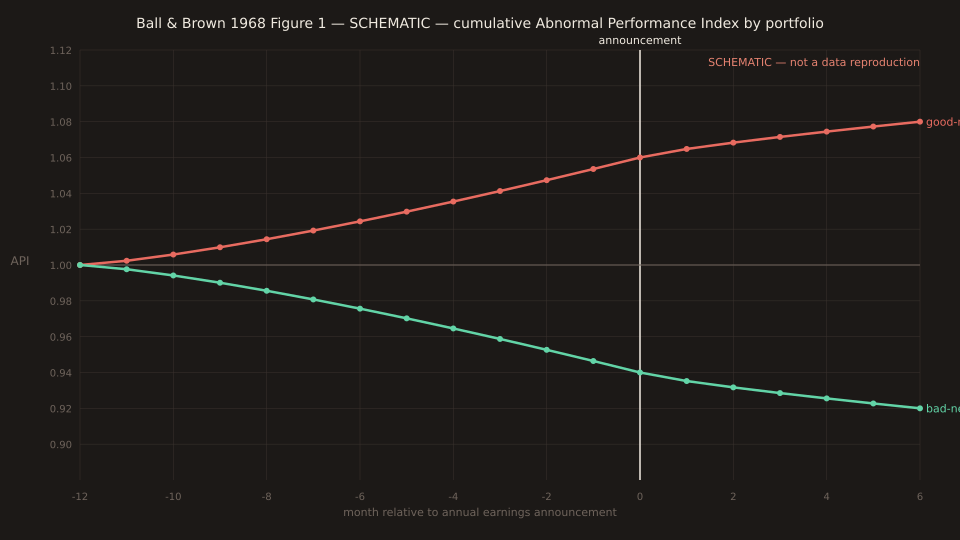
1. Accounting earnings correlate with stock returns. Firms with positive unexpected earnings show positive cumulative abnormal returns; firms with negative unexpected earnings show negative cumulative abnormal returns. The two portfolios diverge continuously over the twelve months leading up to the announcement. Before B&B, the null hypothesis (dominant in the field) was that earnings had no information content; B&B rejected it.
2. Annual earnings lack timeliness. Most of the information the earnings number will eventually convey is alreadyin the price by announcement day. B&B estimated (verbatim from Ball & Brown 1968 page 176, per Gow’s textbook):
of all the information about an individual firm which becomes available during a year, one-half or more is captured in that year's income number. … However, the annual income report does not rate highly as a timely medium, since most of its content (about 85 to 90 per cent) is captured by more prompt media which perhaps include interim reports. — Ball & Brown 1968, p. 176
The 50%+ and 85-90%figures both come from Figure 1 of the paper. The 50%+ is roughly the fraction of total-year price variance associated with the sign of the surprise; the 85-90% is the fraction of the eventual full-year price move that’s already priced in beforethe annual report date. Together they mean: annual earnings ARE informative (against the “irrelevant” null), but by the time they’re released the market has already extracted almost all the value.
3. Post-announcement drift. The residual 10-15%of the total move doesn’t all land on the announcement day. Ball & Brown observed that the two portfolios continue to diverge afterthe announcement, for a matter of months. This is the pattern Bernard & Thomas 1989 (Paper Trail #6) later refined into a decile-portfolio strategy and named post-earnings-announcement drift.
Why this matters for FX news-impact analysis
Ball & Brown established the template for event-driven price analysis of any kind. The pipeline — pick an event class, bucket by surprise magnitude/sign, measure abnormal return around the event, examine the pre-, at-, and post-announcement paths — is the same pipeline Vantage’s News Impact Explorer runs on macro releases and FX moves. B&B’s empirical equity finding maps onto the FX-macro question directly.
Timeliness in FX.If the “85-90% already priced in” observation extends to FX, most of the exchange- rate response to a scheduled release (like NFP or CPI) should already be in the price by the time the number drops — via pre-release pricing based on analyst estimates, high-frequency indicators, and positioning going into the release. The 10-15% residual is what the 15-minute-window analysis is measuring. This is broadly what we see: strong 15-minute reactions on big-magnitude surprises, weaker reactions on in-line prints, and the beat-side/miss-side asymmetry that shows up in the bucket tables. B&B’s equity result predicts the shape.
Post-announcement drift in FX.This is the more interesting question. B&B saw drift in the direction of the surprise for months post-earnings. The FX equivalent would be drift in the same direction as the 15-minute reaction over the 1-hour, 4-hour, and end-of-day windows. Some Vantage posts show exactly this — today’s slot-1 UK CPI × EURGBP post showed EURGBP holds direction from 15m through 4h with negligible fade, mirroring the equity-PEAD template. Other posts show fade rather than drift (e.g. UK CPI × GBPUSD, where the in_line bucket drifts positive by 4h). The FX version of B&B’s PEAD is pair- and event-specific — a research question the tool is set up to explore systematically.
The intellectual context
Ball & Brown 1968 is contemporary with three other foundational papers of empirical finance (per Williams 2019’s history):
- Sharpe (1964) and Lintner (1965)— the Capital Asset Pricing Model, used to compute the expected-return benchmark against which B&B measure “abnormal” returns.
- Fama (1970 — Paper Trail #4)— the Efficient Market Hypothesis. B&B’s PEAD finding is the first serious counter-evidence to the semi-strong form of EMH; Fama’s 1998 retrospective (“Market efficiency, long-term returns, and behavioral finance”) explicitly discusses B&B as one of the durable underreaction anomalies EMH has to accommodate.
- Fama-Fisher-Jensen-Roll (1969)— the stock-splits event study. Established the CAR/API methodology that B&B applied to earnings.
Together these papers kicked off the empirical corporate-finance literature of the 1970s. Ball & Brown’s specific contribution was to demonstrate that accounting numbers matter for prices — an empirical foundation the whole accounting-research field would build on. Ted Watts and Ross Zimmerman’s Positive Accounting Theory of the late 1970s traces back to this paper.
Why it took 21 years to formalize PEAD
Ball & Brown observed the post-announcement drift but didn’t provide a formal decile-based statistical characterisation — that had to wait for Bernard & Thomas 1989 (Paper Trail #6). In between, the field spent two decades debating whether the drift was (a) a mismeasured risk premium (the CAPM/market-model benchmark is imperfect, so “abnormal” returns might just be compensation for risk factors the benchmark misses), (b) a transaction-cost artifact (the anomaly disappears once you account for bid-ask spreads and commissions on the small stocks that exhibited it most strongly), or (c) genuine investor underreaction — the behavioral-finance interpretation Fama 1998 acknowledged even while defending EMH.
Bernard & Thomas 1989 came down decisively on (c): the drift is genuine, the size is roughly 8% annualized in the 60 days after the release, and it can’t be explained by conventional risk factors or transaction costs. Fama-French 1993 (Paper Trail #8) added the size and value factors but PEAD survives the 3-factor benchmark; Carhart 1997 (Paper Trail #11) added momentum and PEAD survives that too. The anomaly Ball & Brown first observed in 1968 has proven durable for close to six decades.
Reader’s note
The bibliographic details above (JAR vol. 6, issue 2, pp. 159-178, DOI 10.2307/2490232) are verified from Williams 2019’s reference list and IDEAS/RePEc, both of which cite the paper identically. The 261-firms and 2,349-firm-year sample figures are cited consistently across secondary sources but I haven’t confirmed them against the 1968 paper directly today. A subsequent run with JSTOR access should verify or correct any specific numerical claims that didn’t appear in one of the three open-access secondary sources cited above — particularly the exact Figure 1 API axis values, which I have only characterised qualitatively.
If you have institutional access via JSTOR, the paper is a remarkably readable 20-page document — the 1968 JAR prose is much less dense than modern finance journal writing. It’s worth reading start to finish alongside Bernard & Thomas 1989 (Paper Trail #6) as the original / follow-up pairing for the entire PEAD literature.