Canada's Trimmed CPI is the second BoC-preferred inflation metric to move its USD pair monotonically — and 5 of 5 big-miss prints pushed USDCAD up
82 monthly Trimmed-Mean CPI prints since 2010, split into five surprise buckets on USDCAD 15-minute moves. Medians: +15.8 / +6.1 / +2.2 / −9.0 / −2.0 pips. Five of five big-miss prints and sixteen of twenty-two small-miss prints pushed USDCAD higher. Whipsaw rate on the big-miss bucket: 0%.
The Bank of Canada explicitly names three core inflation measures in every MPR: CPI-trim, CPI-median, CPI-common. This post is about the first one. When the market re-prices the BoC’s next move, the trim print is what it re-prices against — and USDCAD is the pair where that re-pricing shows up mechanically first.
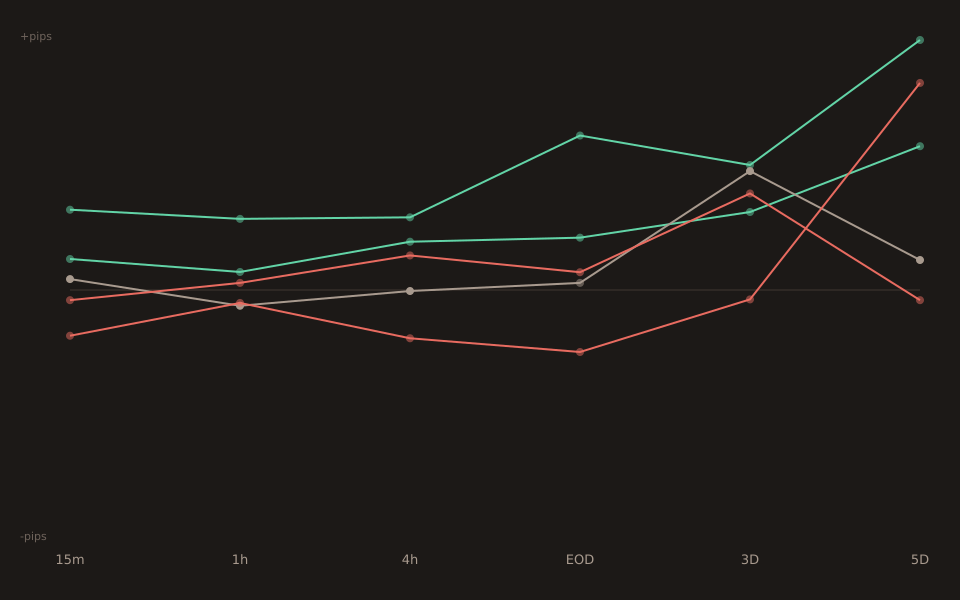
The bucket table
| Bucket | n | 15m median | 30m median | 1h median | Pct up (15m) |
|---|---|---|---|---|---|
| big_miss | 5 | +15.8 | +16.8 | +14.0 | 100% |
| small_miss | 22 | +6.1 | +6.3 | +3.5 | 73% |
| in_line | 30 | +2.2 | +2.9 | −3.1 | 60% |
| small_beat | 14 | −9.0 | −8.3 | −2.5 | 36% |
| big_beat | 11 | −2.0 | +1.4 | +1.4 | 36% |
Read down the pct-up column: 100 / 73 / 60 / 36 / 36. Monotonic through four of five buckets, and even the beat-side tail ties rather than reversing. The 0% whipsaw rate on big_miss is the more remarkable number for anyone actually trading the print — every one of the five big-miss releases had USDCAD go up and stay up through the fifteen-minute window (no low-then-high round-trip).
The five big-miss prints, individually
Small enough sample that they’re listable. All five went one direction:
2026-07-20 1.80% vs 2.00% fc z=-2.21 +5.3p 2025-04-15 2.80% vs 3.00% fc z=-2.03 +10.9p 2026-02-17 2.40% vs 2.60% fc z=-1.65 +15.8p ← median 2026-05-19 2.00% vs 2.20% fc z=-1.61 +21.5p 2022-09-20 5.20% vs 5.50% fc z=-1.68 +30.2p
Note the misses are all in the 0.2-0.3 percentage-point range. That’s what a “big miss” looks like in a low-inflation regime with well-anchored surveys: not a 1-point miss, just a firmer-than-expected forecast getting undercut by two tenths. Small in absolute terms, but consistent — enough for the OIS curve to pull the BoC-easing timeline forward by a few basis points and for CAD to drop against the USD accordingly.
How it stacks up next to Australia’s Trimmed Mean
Yesterday’s Insights post covered the AUD Trimmed Mean CPI on AUDUSD — same class of release (central-bank-preferred core inflation gauge), same 5-bucket monotonic shape, same beat-side compression relative to the miss side. Two data points isn’t a series, but the family resemblance is striking.
| Event | Pair | n | big_miss med | big_beat med | pct_up big_miss |
|---|---|---|---|---|---|
| AUD Trimmed Mean CPI q/q | AUDUSD | 67 | −36.0 | +12.8 | 0% |
| CAD Trimmed-Mean CPI y/y | USDCAD | 82 | +15.8 | −2.0 | 100% |
The sign flip between rows is a currency-convention artifact, not an economic one: AUDUSD quotes AUD as the base (miss weakens AUD → AUDUSD down), USDCAD quotes CAD as the quote (miss weakens CAD → USDCAD up). Both rows say the same thing in local weaker-currency terms. And both show the same big-miss unanimity: 0% of AUD big-miss prints saw AUDUSD up and 100% of CAD big-miss prints saw USDCAD up — both the strongest possible directional claim on their respective tails.
What this doesn’t say
Tail buckets are small. big_miss n=5 and big_beat n=11. Per Stats for Traders #3, the 95% CI on the median at n=5 is very wide — the +15.8p point estimate carries substantial uncertainty around its magnitude. Trust the sign; the miss-side unanimity across five prints is meaningful evidence of direction; don’t trust two decimal places of the median or the exact pct-up figure.
small_beat median is bigger than big_beat median. −9.0p vs −2.0p. Same non-monotonicity the AUD post flagged, same likely cause (small tail-bucket samples aren’t stable). Treat both as “beats push USDCAD down” and don’t read too much into the magnitude-vs-surprise-size ordering.
15-minute and 30-minute windows agree; 1h drifts. The 1h column shows the in_line bucket dip to −3.1p and the small_beat bucket recover to −2.5p from −9.0pat 15m. That’s consistent with a story where the 15-30m window captures the release re-pricing and the 1h window starts picking up unrelated NY-morning USDCAD flow. If you’re trading this event, the first 30 minutes are the cleanest window.
Open the tool → Free forever. No signup. No email required.