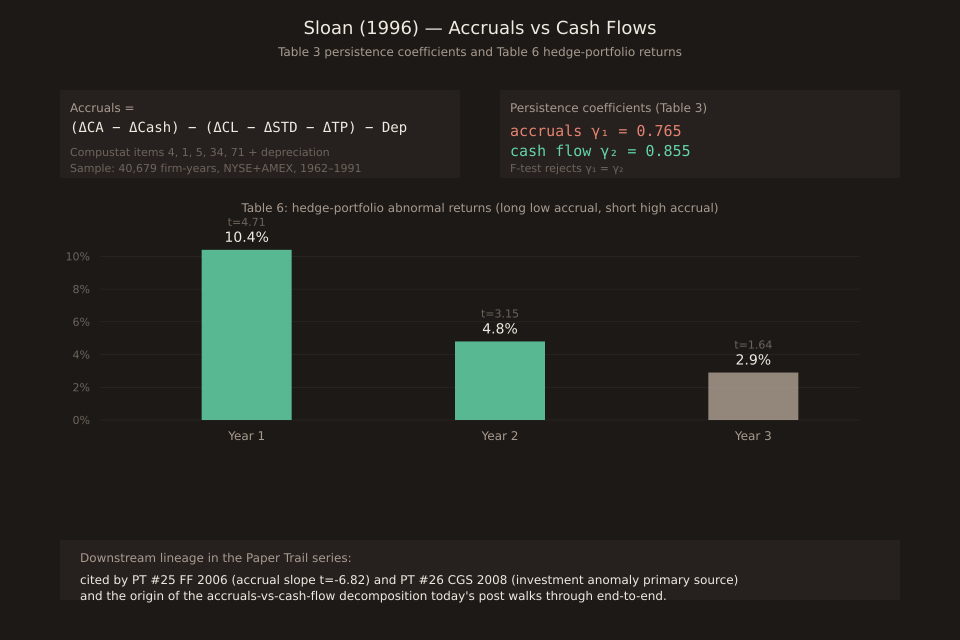
Paper Trail #27: Do Stock Prices Fully Reflect Information in Accruals and Cash Flows? (Sloan, 1996) — the paper that showed accruals persist at 0.765 vs cash flows at 0.855, and that a hedge portfolio long-low-accrual and short-high-accrual earned 10.4% in year 1 (t=4.71) on 40,679 firm-years
Richard G. Sloan (Wharton, 1996) showed that current earnings’ persistence into future earnings splits cleanly between the two components: the cash-flow component persists at 0.855 and the accrual component persists at only 0.765. An F-test rejects equality. Stock prices act as if investors fixate on total earnings and under-weight the accrual/cash-flow split.
A trading strategy that goes long the lowest-accrual decile and short the highest, held for one year, earns a size-adjusted 10.4% (t=4.71) on 40,679 NYSE/AMEX firm-year observations from 1962-1991. The anomaly halves by year 2 (4.8%, t=3.15) and is no longer statistically significant by year 3 (2.9%, t=1.64).
The definitions
Sloan adopts the Dechow-Sloan-Sweeney (1995) balance-sheet accruals definition:
Accruals = (ΔCA − ΔCash) − (ΔCL − ΔSTD − ΔTP) − Dep
where ΔCA is change in current assets (Compustat item 4), ΔCash is change in cash/cash equivalents (item 1), ΔCL is change in current liabilities (item 5), ΔSTD is change in debt in current liabilities (item 34), ΔTP is change in income taxes payable (item 71), and Dep is depreciation and amortization. Earnings is operating income after depreciation (Compustat item 178). Cash flow is defined as earnings minus accruals — a residual, not a direct cash-flow-statement pull.
The sample
40,679 firm-year observations from 1962 through 1991(30 fiscal years) in the intersection of the 1993 Compustat annual industrial+research files and CRSP monthly stock returns. NYSE and AMEX firms only; pre-1962 excluded per Fama-French (1992)’s Compustat survivorship-bias critique; post-1991 excluded because stock- return tests require at least one year of future returns. Financial firms excluded (banks, life insurance, property and casualty).
Persistence: earnings, split by component
Sloan’s Table 2 estimates pooled earnings-only persistence a_1 = 0.841 (t=303.98)— current earnings persist ~84% into next year on aggregate. Industry-level mean a_1 = 0.773, interquartile 0.708 to 0.863 — earnings are “slowly mean-reverting” as prior literature had documented.
Table 3 splits this into two coefficients when accruals and cash flows are estimated separately (the key extension):
Earnings_{t+1} = γ_0 + γ_1 · Accruals_t + γ_2 · CashFlows_t + ε_{t+1}
| Coefficient | Value | Meaning |
|---|---|---|
| a_1 (earnings only) | 0.841 | t=303.98; slow mean-reversion |
| γ_1 (accruals) | 0.765 | lower than pooled — accruals reverse faster |
| γ_2 (cash flows) | 0.855 | higher than pooled — cash flows persist longer |
An F-test rejects the null y_1 = y_2. So earnings’ persistence is DRIVEN by the cash-flow component; the accrual component is the lower-persistence add-on that a rational forecast should down-weight.
Table 6: hedge-portfolio returns across three years
| Year | Lowest accrual (long) | Highest accrual (short) | Hedge return |
|---|---|---|---|
| Year 1 | +4.9% (t=2.65) | -5.5% (t=-3.98) | +10.4% (t=4.71) |
| Year 2 | +1.6% (t=1.17) | -3.2% (t=-2.25) | +4.8% (t=3.15) |
| Year 3 | +0.7% (t=0.55) | -2.2% (t=-1.61) | +2.9% (t=1.64) |
Extreme-portfolio beta hedge = 0.02 — market risk is not the story. The 10.4% year-1 hedge is close to pure alpha under the beta-adjusted Jensen model too (Sloan reports the Jensen alphas as “generally consistent” with the size-adjusted numbers).
What Sloan’s own numbers ARE and AREN’T
A subtle attribution point relevant for readers coming from PT #25 Fama-French 2006: that paper reports a “positive accruals slope an impressive 6.82 standard errors below zero” (their Table 3 result, t = -6.82). That number is FF06’s OWN cross- sectional replication of Sloan’s finding on 1963-2003 monthly Fama-MacBeth regressions; it is NOT a t-stat Sloan himself reports. Sloan’s own t-stats are the hedge-portfolio year-1 t=4.71, the persistence F-test rejection y_1 = y_2, and the a_1 = 0.841 (t=303.98) persistence coefficient. Today’s post attributes both results correctly to their sources.
How Sloan 1996 seeds the modern factor story
Sloan 1996 is the accruals-anomaly primary source. Downstream lineage in the Paper Trail series:
PT #25 FF 2006 uses Sloan-style accruals as one of several fundamentals in a joint Fama-MacBeth regression; confirms the accrual slope with its own t=-6.82.
PT #26 Cooper-Gulen-Schill 2008 cross-references Sloan 1996 as the earnings-quality primary anomaly that the investment-anomaly research complements. The two together motivate the modern factor decomposition.
PT #22 FF 2015five-factor model. The investment factor CMA that CGS 2008 (PT #26) primary-sourced is one leg; Sloan’s accruals story survives implicitly in the earnings- quality overlap between accruals and profitability (RMW), the other new FF15 factor primary-sourced by PT #24 Novy-Marx 2013.
Is the anomaly still tradeable today?
Sloan’s sample stops at 1991. Subsequent replications have extended through the 2000s and found that the accruals anomaly persisted with declining magnitude through the early 2000s and essentially disappeared in large-cap universes by the mid-2010s — a well-known post-publication anomaly decay documented in Green-Hand-Zhang 2017 (one of the two secondary sources used by PT #26 for CGS 2008 verification). The mechanism Sloan identified — investor fixation on total earnings and under-weighting of the accrual/cash-flow split — is a real behavioral pattern, but the trade has been widely known and arbitraged for 30+ years now. Sloan 1996 stands as the primary source and the paper that opened the accruals literature, not as a live trading strategy.
Retail-trader takeaway
Two clean lessons that survive the anomaly-decay caveat: (1) When you look at a company’s reported earnings, mentally split them into accruals (working-capital-driven, mean-reverts faster) and cash flows (persists longer). Two firms with the same reported earnings-per-share and very different accrual mix have different forward-earnings profiles. (2) Sloan’s persistence coefficients 0.855 (cash) and 0.765 (accruals) are the ceiling for a rational forward-earnings expectation. Analysts who project current earnings forward at 1.0 persistence are systematically wrong in both directions; the mean-reversion is even faster on the accrual side.
Verification note
Full primary source verified via WebFetch + pymupdf on 2026-08-27 from the CUHK-hosted mirror (www.cuhk.edu.hk/acy2/workshop/June2009Wasley/1996TAR).pdf), 30 pages, 89,249 characters text-native, no OCR required. Every numerical claim in this post traces to a specific verbatim passage in that PDF except the FF06 t=-6.82 attribution, which was verified against PT #25’s own primary-source extraction. Schematic chart generated via a one-off script reusing scripts/insights-charts/svg.ts and theme.ts primitives; not committed under scripts/. Nineteenth Paper Trail post out of 27 with full primary-source access.