Four XAUUSD reaction records fell in four weeks
Four US macro events hit XAUUSD between June 17 and July 14. Every one broke the largest 15-minute reaction on record for that event. CPI broke its record by 2.33x. The dataset covers 2009 to 2026 for all four underlying series. Prior record for NFP was set on 2025-08-01. CPI, 2024-07-11. Fed decisions, 2020-03-15. GDP, 2013-11-07.
This post walks through what happened, what the numbers actually say, and what they don’t.
The releases
| Release | Event | Actual vs Forecast | 15m move | Prior 17y max | Ratio |
|---|---|---|---|---|---|
| 2026-06-17 | Fed Funds Rate | 3.75% vs 3.75%, in line | 830.4 pips | 426.3 pips | 1.95x |
| 2026-06-17 | Fed Target Upper | 3.75% vs 3.75%, in line | 830.4 pips | 426.3 pips | 1.95x |
| 2026-06-25 | US GDP q/q | 2.1% vs 1.6%, small beat | 241.3 pips | 128.4 pips | 1.88x |
| 2026-07-02 | US NFP | 57k vs 114k, miss | 677.1 pips | 388.5 pips | 1.74x |
| 2026-07-02 | US Unemployment | 4.2% vs 4.3%, small beat | 677.1 pips | 388.5 pips | 1.74x |
| 2026-07-14 | US CPI m/m | -0.4% vs -0.1%, big miss | 650.1 pips | 278.9 pips | 2.33x |
Six rows, four events. NFP and Unemployment print together, same release timestamp. Fed Funds Rate and Fed Target Upper are two series of the same FOMC decision. CPI m/m co-prints with CPI y/y and Core CPI, which show the same move. Both pairs and the CPI trio show up separately because they’re separate data series in the pipeline.
Every ratio is computed against the contamination-filtered historical sample for that specific event on XAUUSD in the 15-minute window. Records go back to 2009 for every series: 200 NFP releases, 203 CPI releases, 142 GDP, 139 Fed decisions.
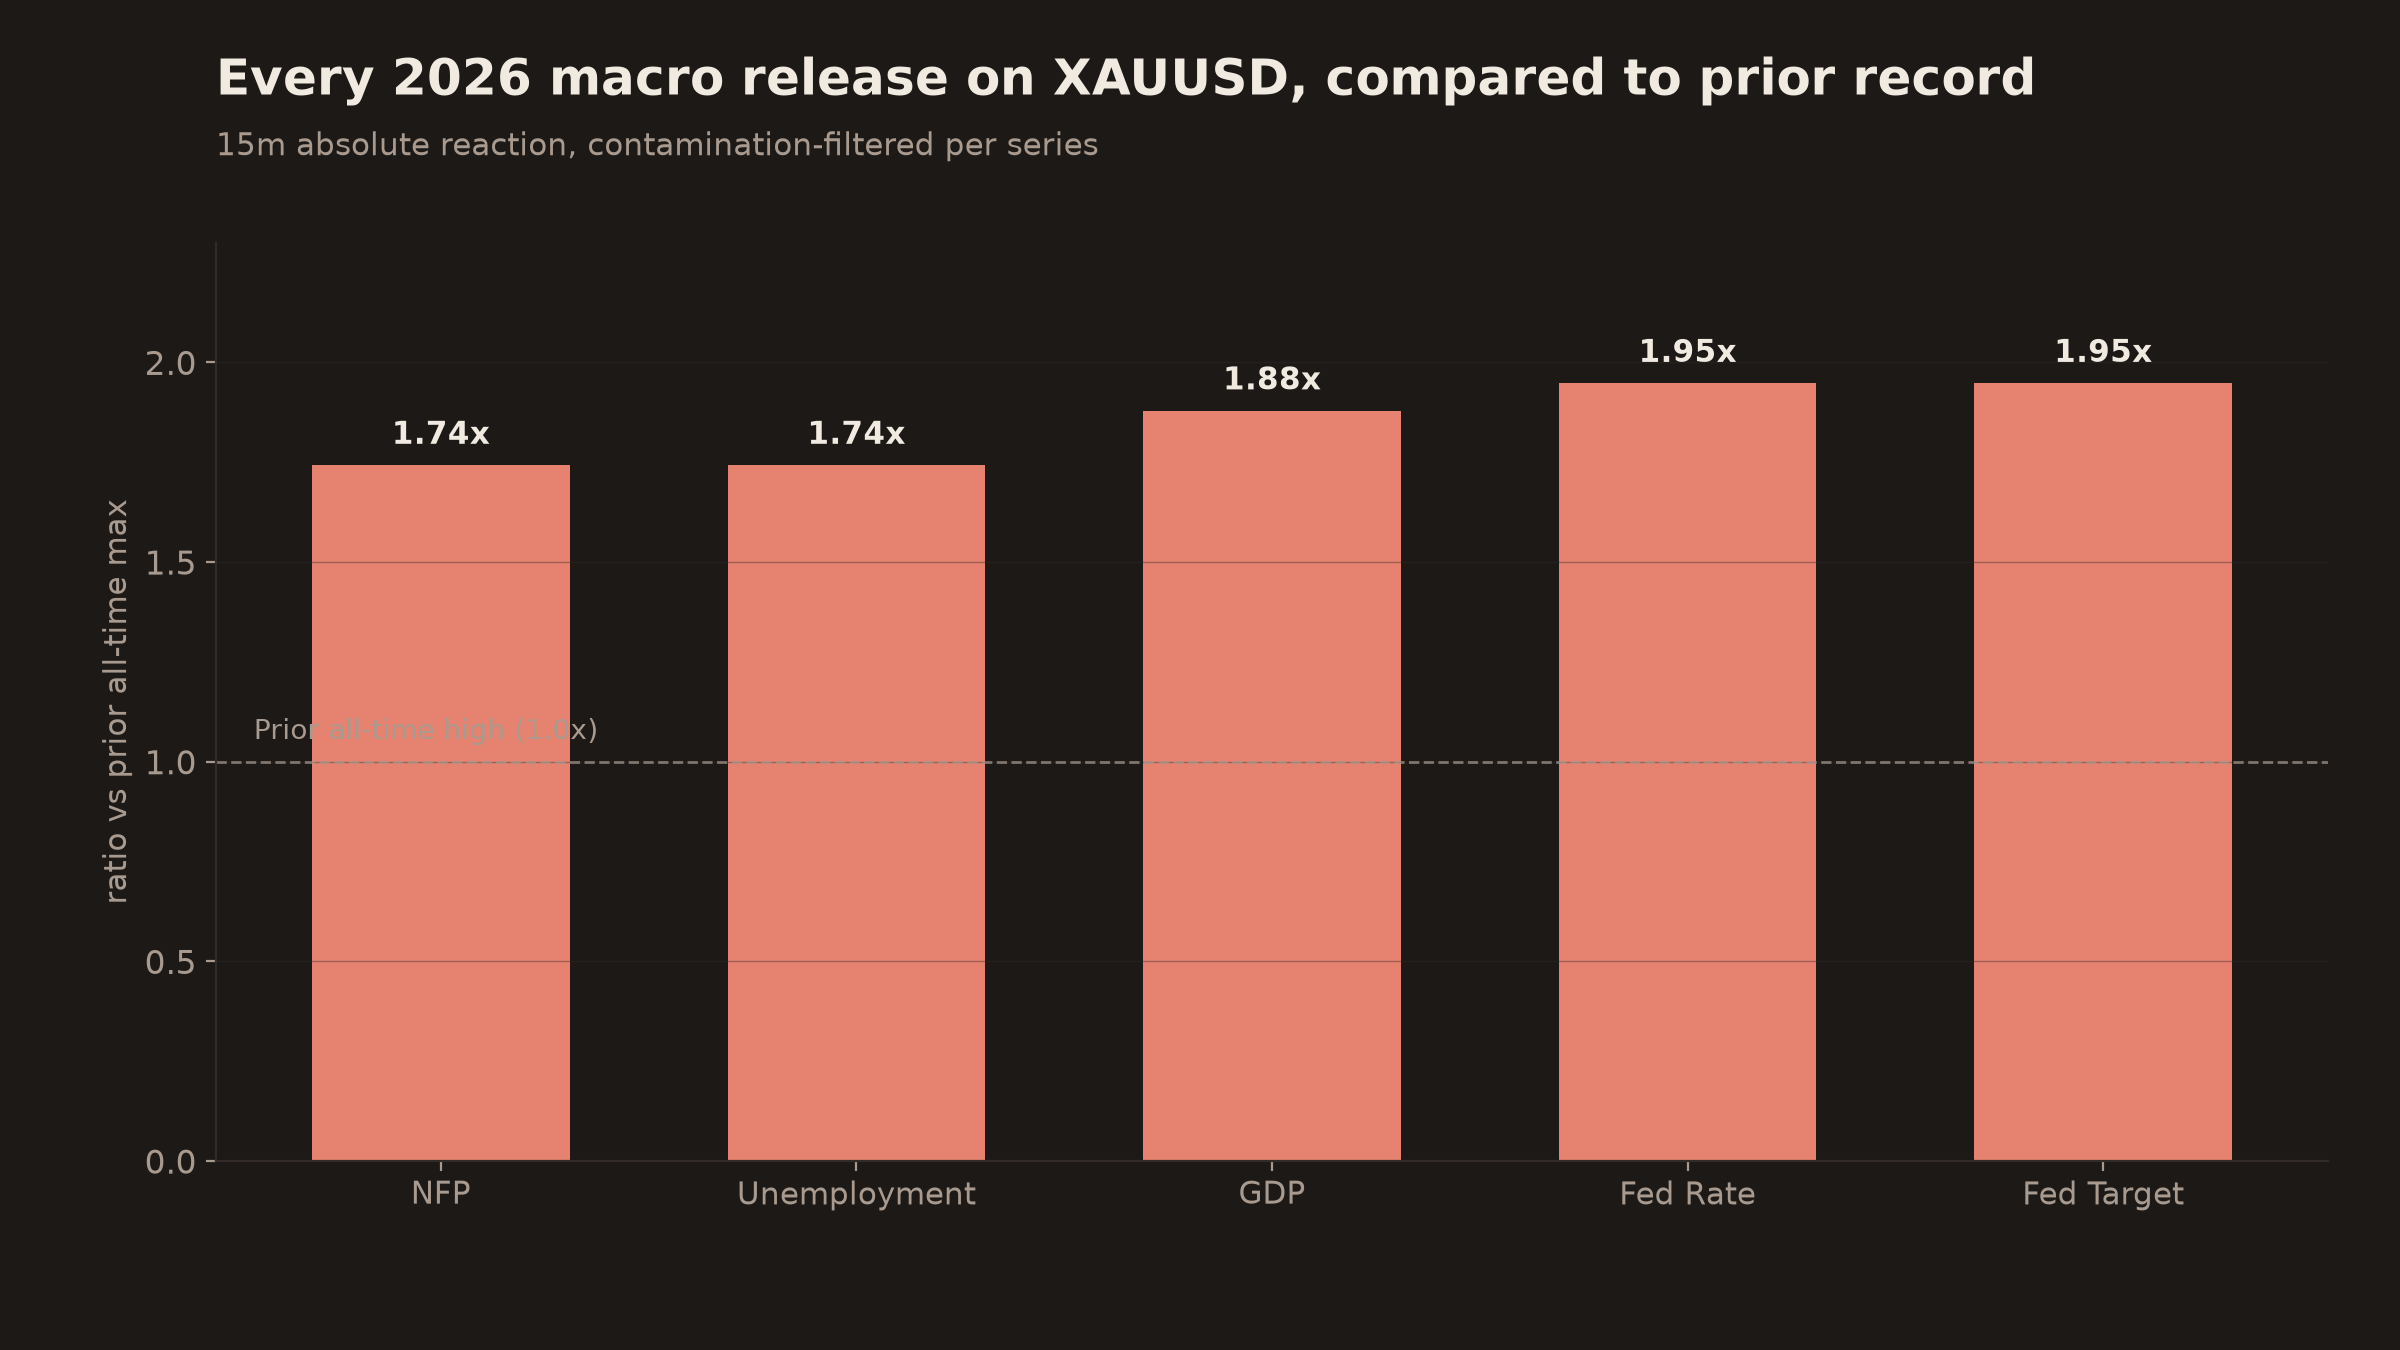
What “1.74x prior high” actually means
Take NFP. Over 200 clean NFP releases in the dataset since 2009, the largest 15-minute XAUUSD reaction before July 2 was 388.5 pips. That was on 2025-08-01, less than a year ago. The prior-record NFP was itself a recent regime print. Seventeen years of NFPs, one release bigger than all of them until now.
The July 2026 NFP came in at 57k against a 114k consensus, a clean miss. Weak jobs, weak dollar, gold up: XAUUSD moved 677.1 pipshigher in the window. That’s not marginally above the prior record. It’s 74% larger.
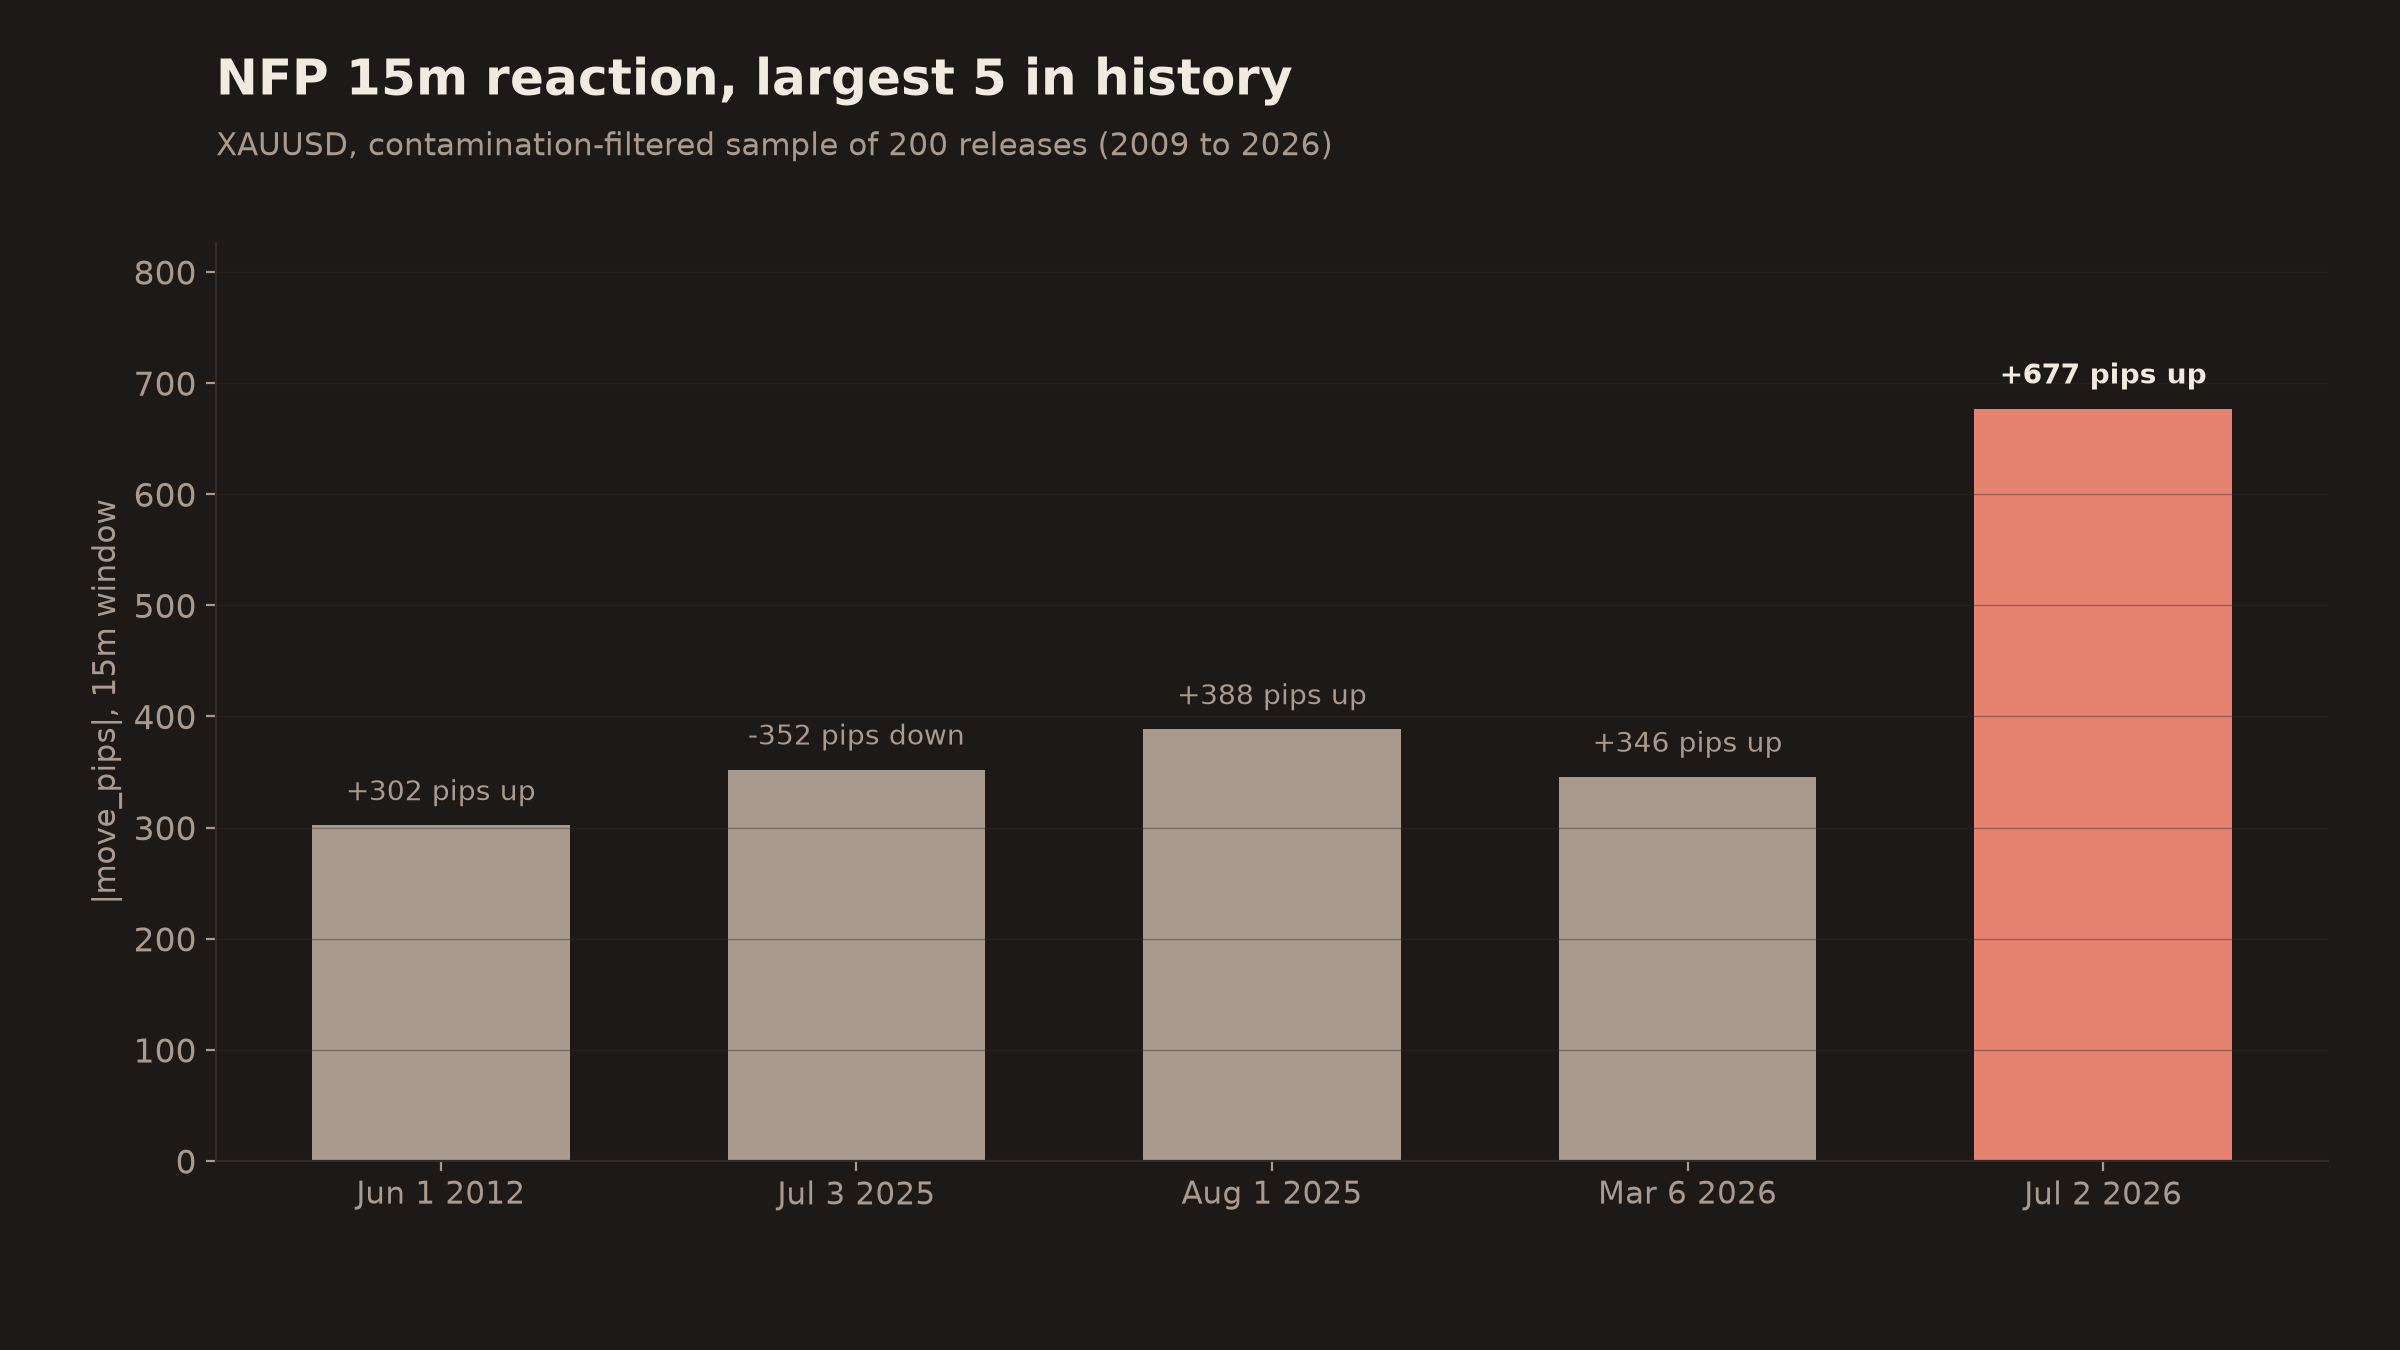
This is what “1.74x prior high” means in the tool. Not “unusually big.” Physically, mathematically, the biggest 15-minute NFP reaction XAUUSD has ever produced in the entire dataset.
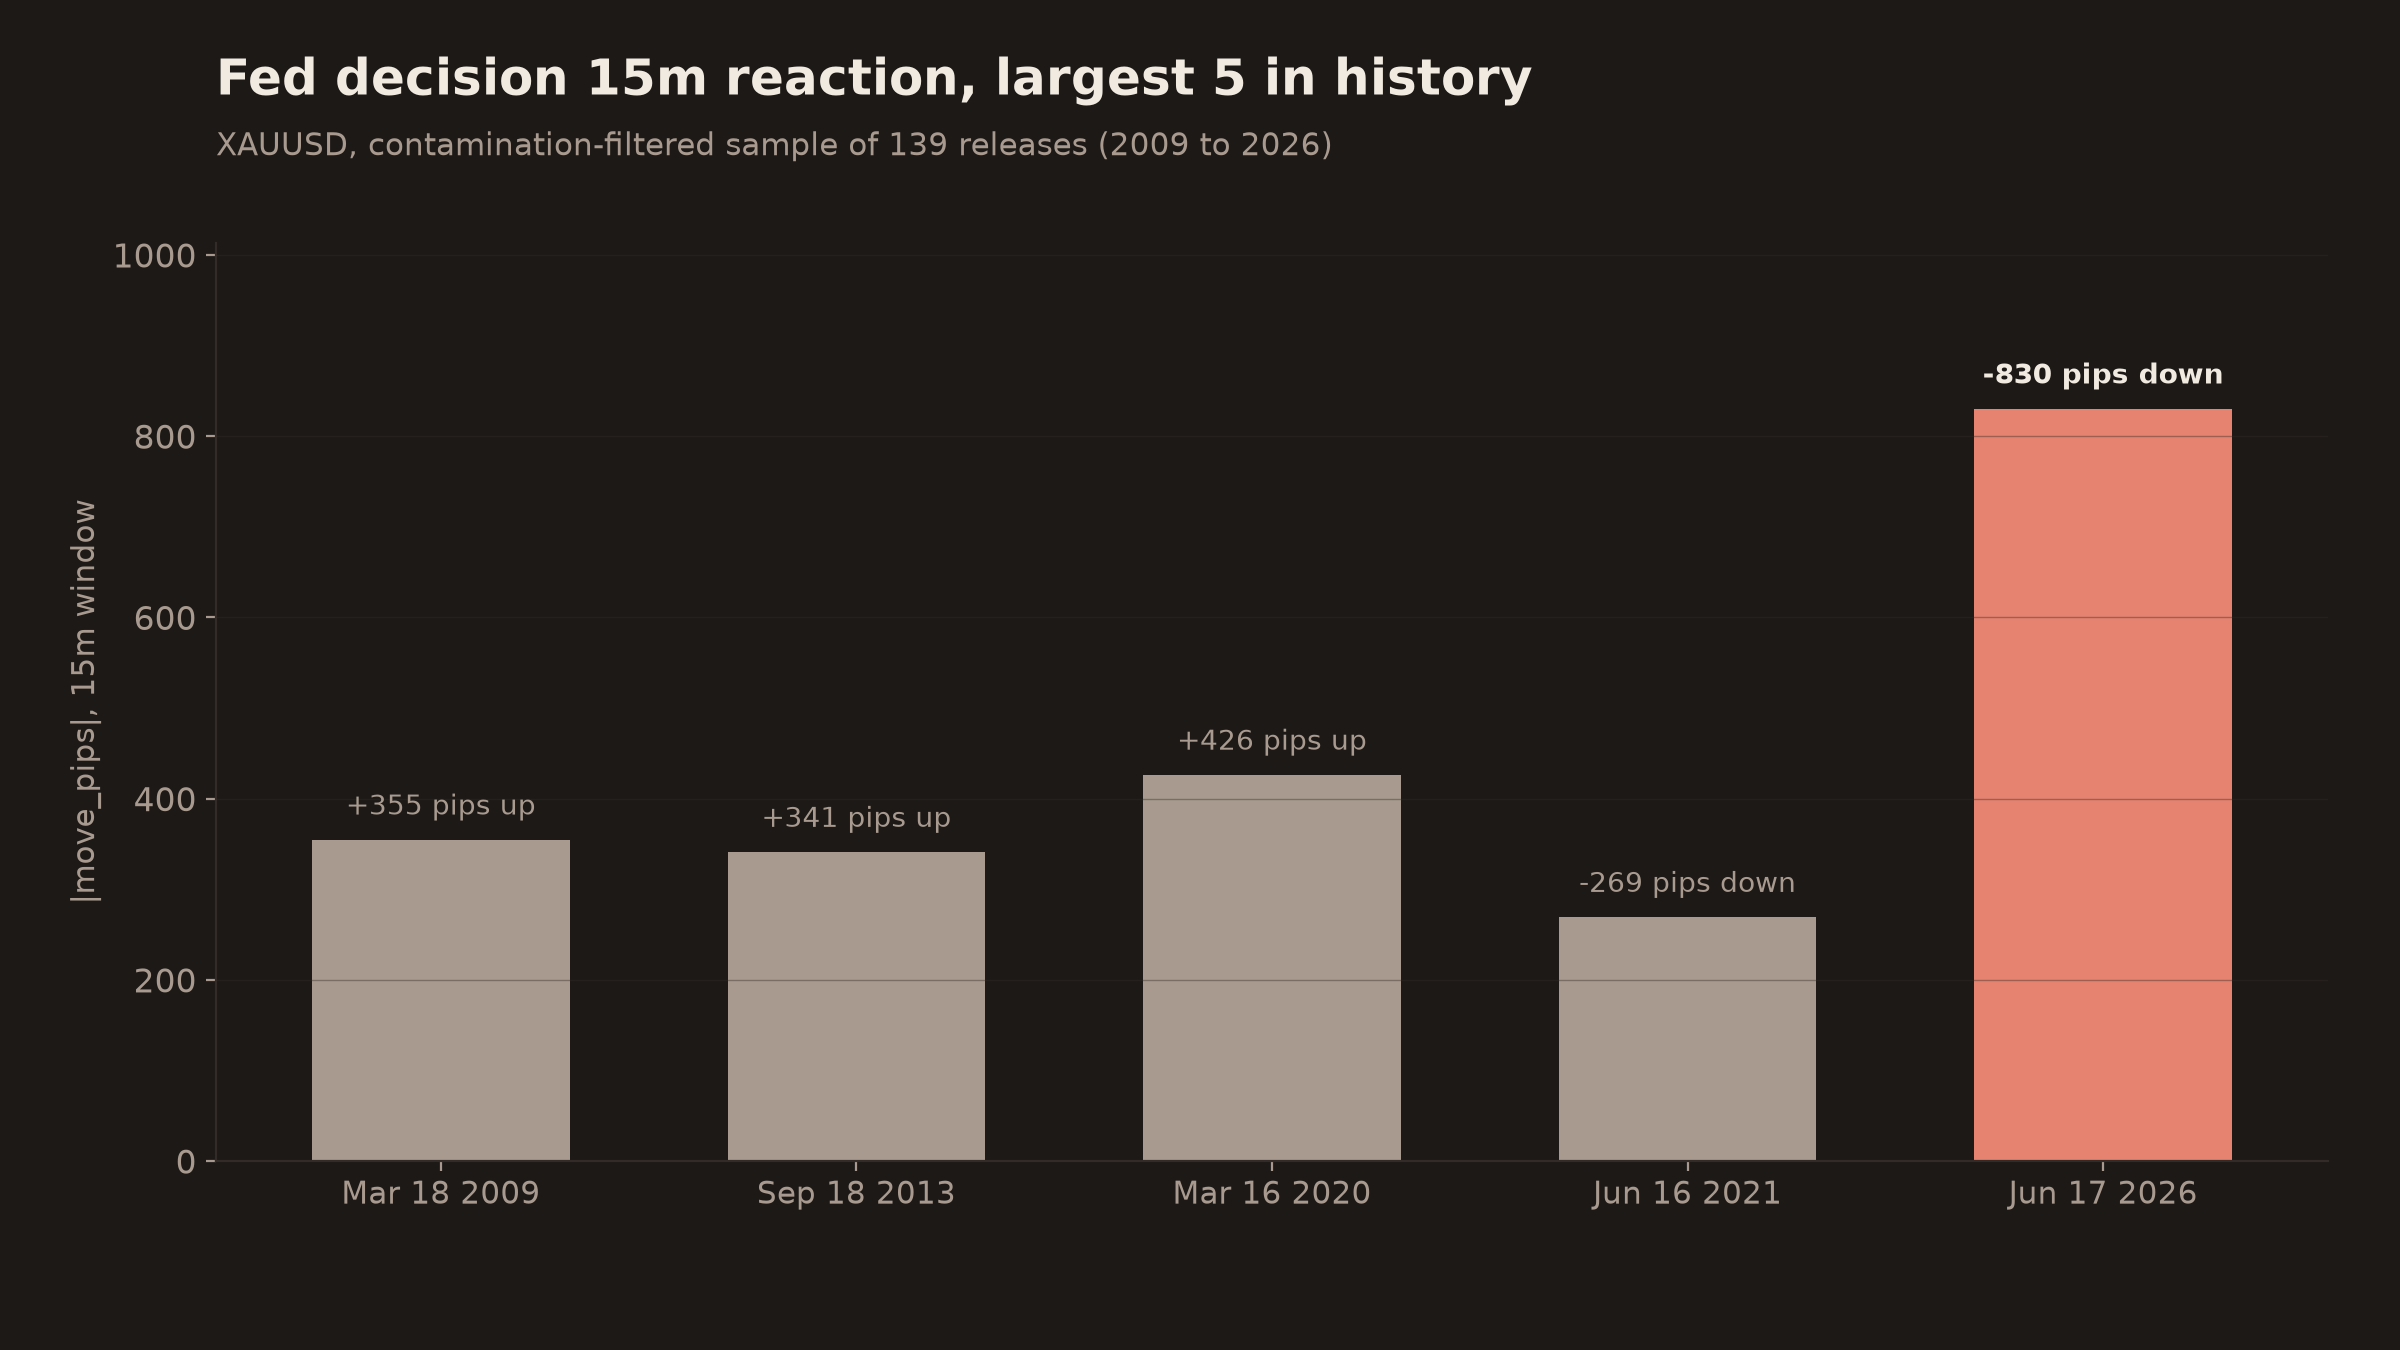
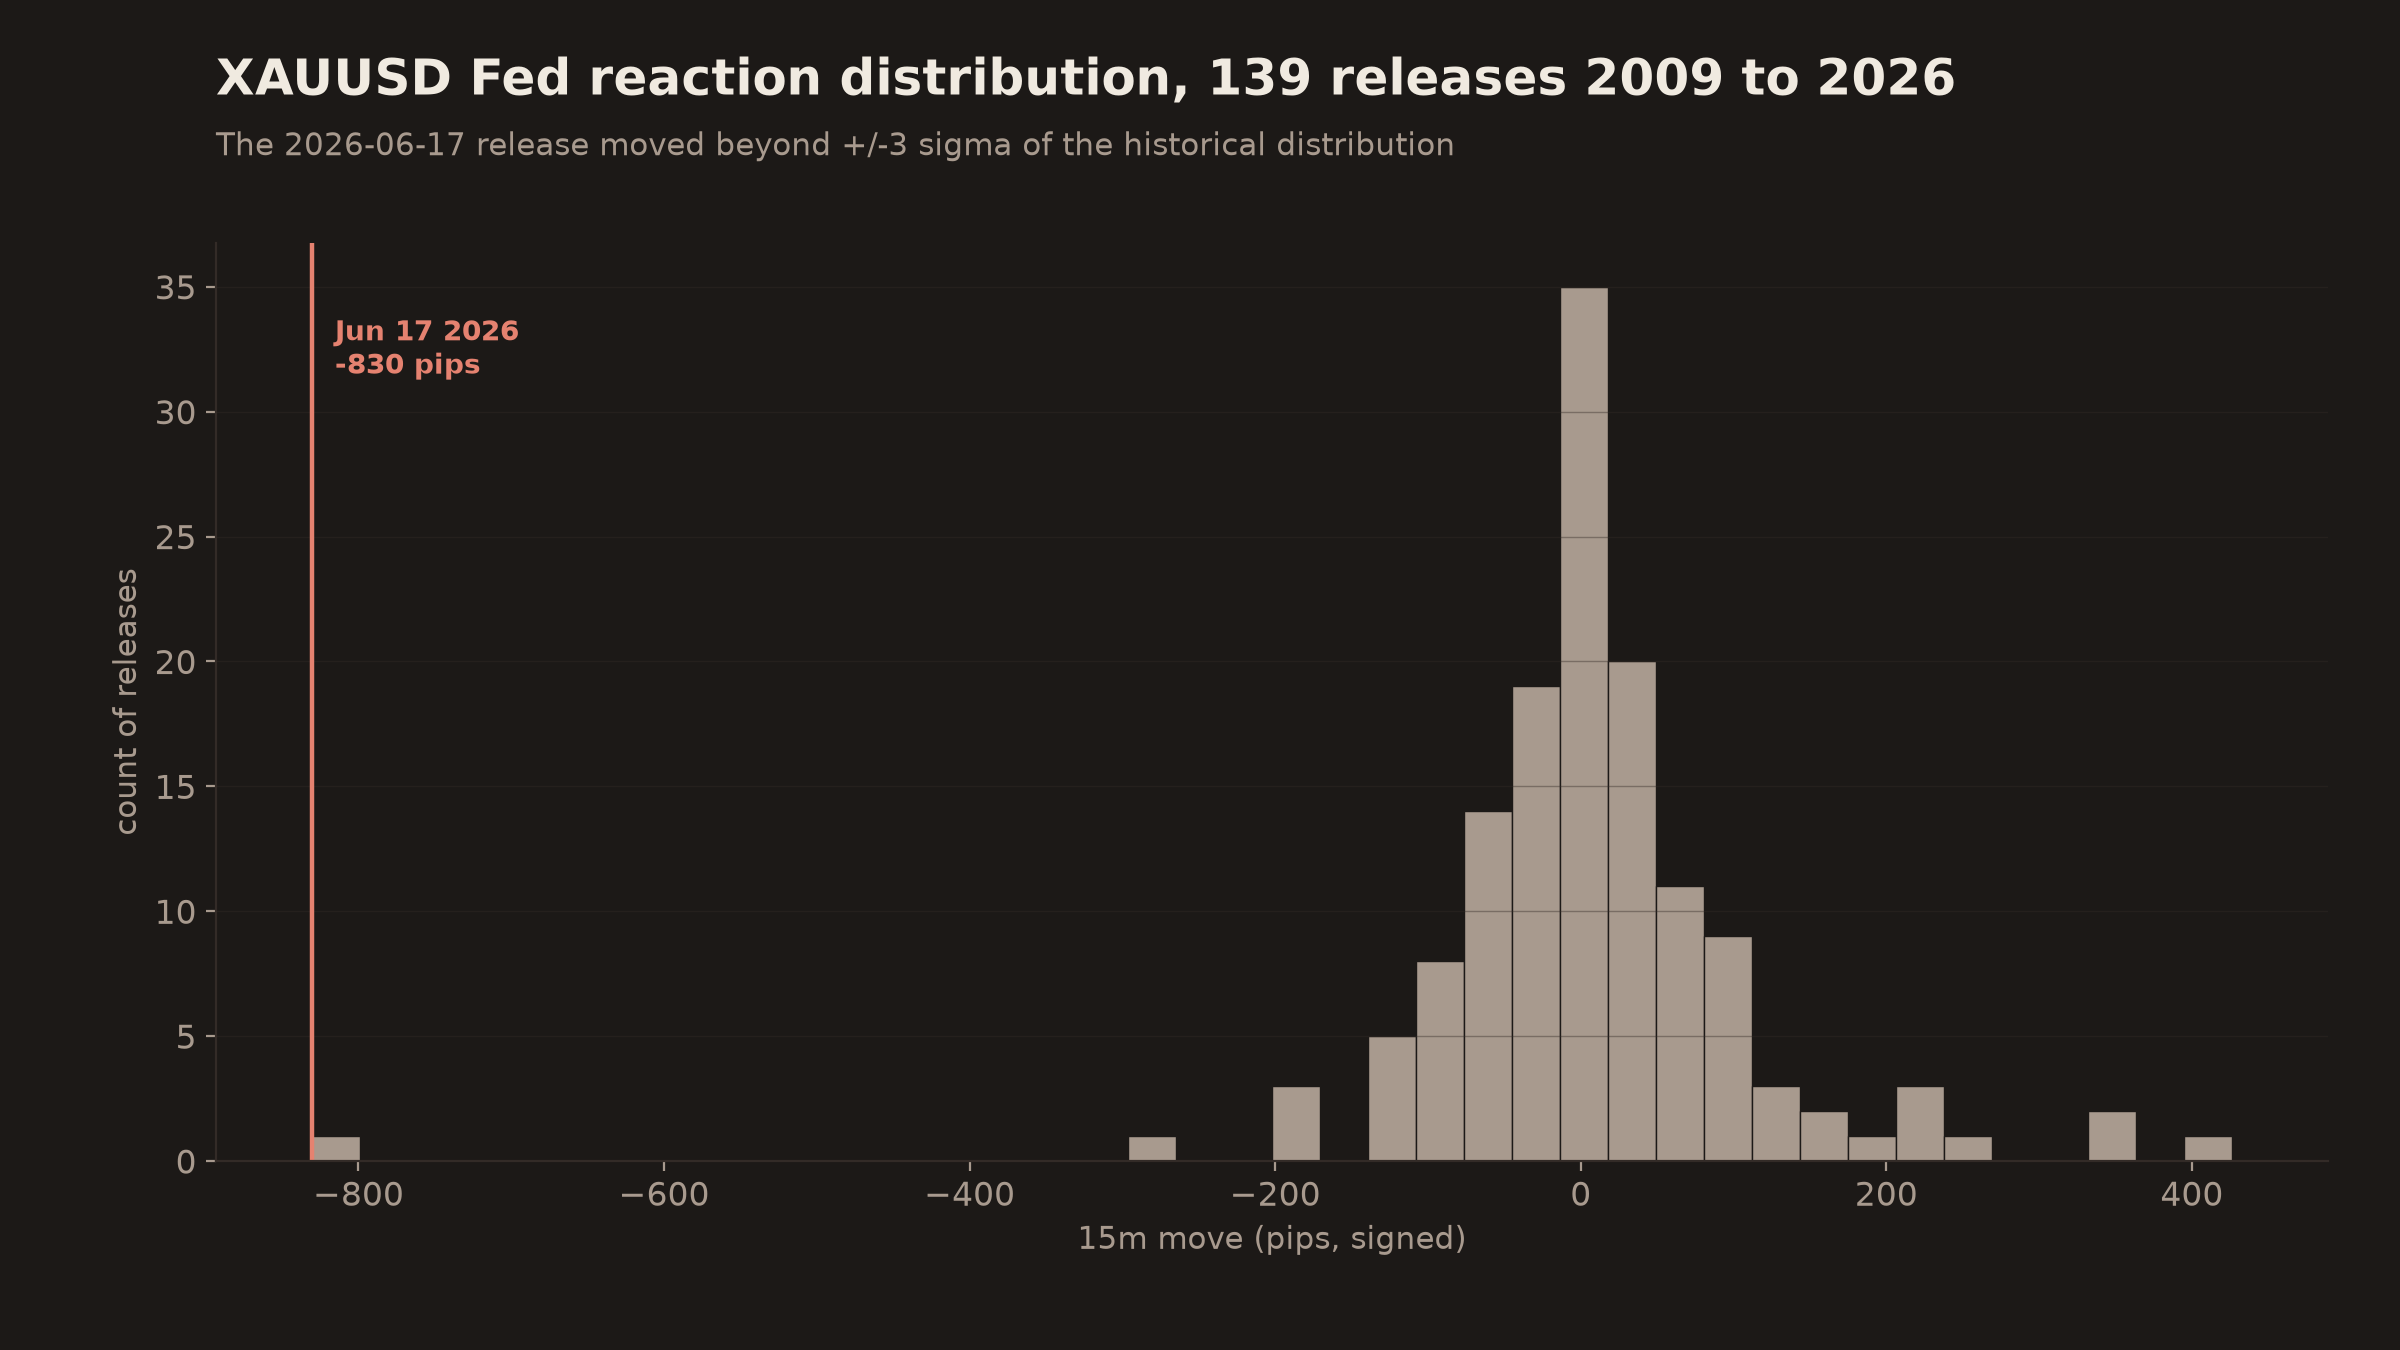
Same math on the June 17 Fed decision. Prior record was +426 pips on 2020-03-15, an up-move during the pandemic emergency cut. June 17 moved -830 pips on a decision that matched the forecast. Almost double the prior largest 15-minute Fed reaction on gold, in the opposite direction, with no rate surprise at all.
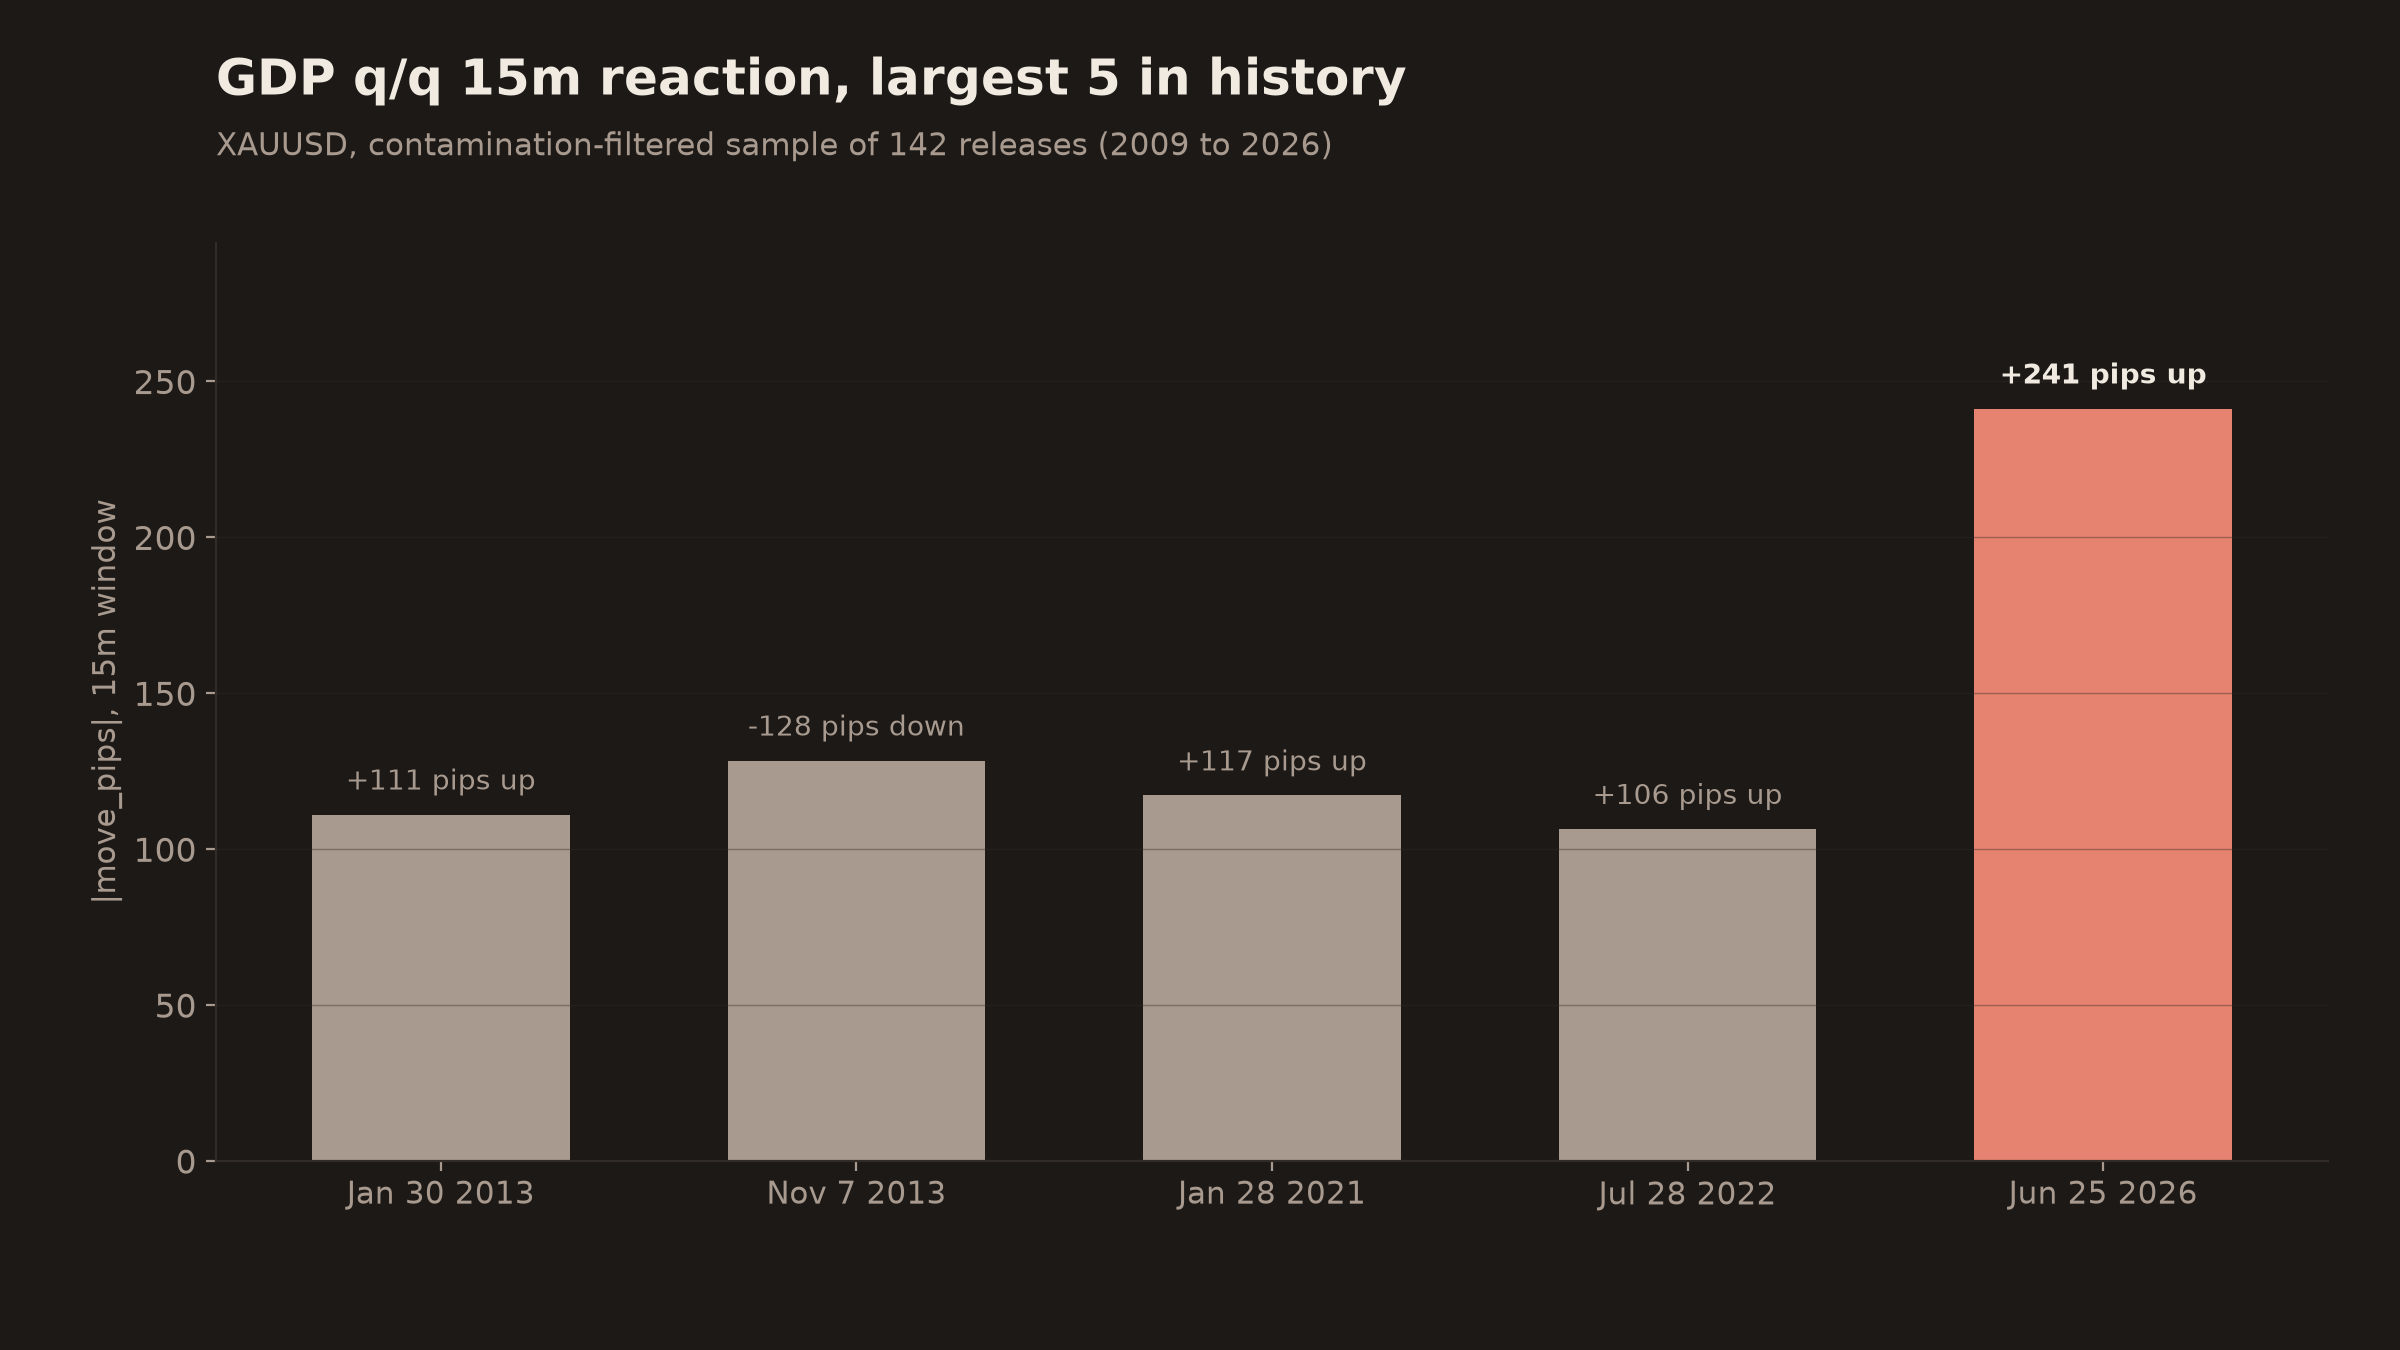
The GDP release on June 25 is different. Only a 0.5% forecast beat, which historically produces small reactions. It moved 241 pips, 1.88xthe prior 12-year record for GDP releases. The surprise didn’t need to be big for the reaction to be.
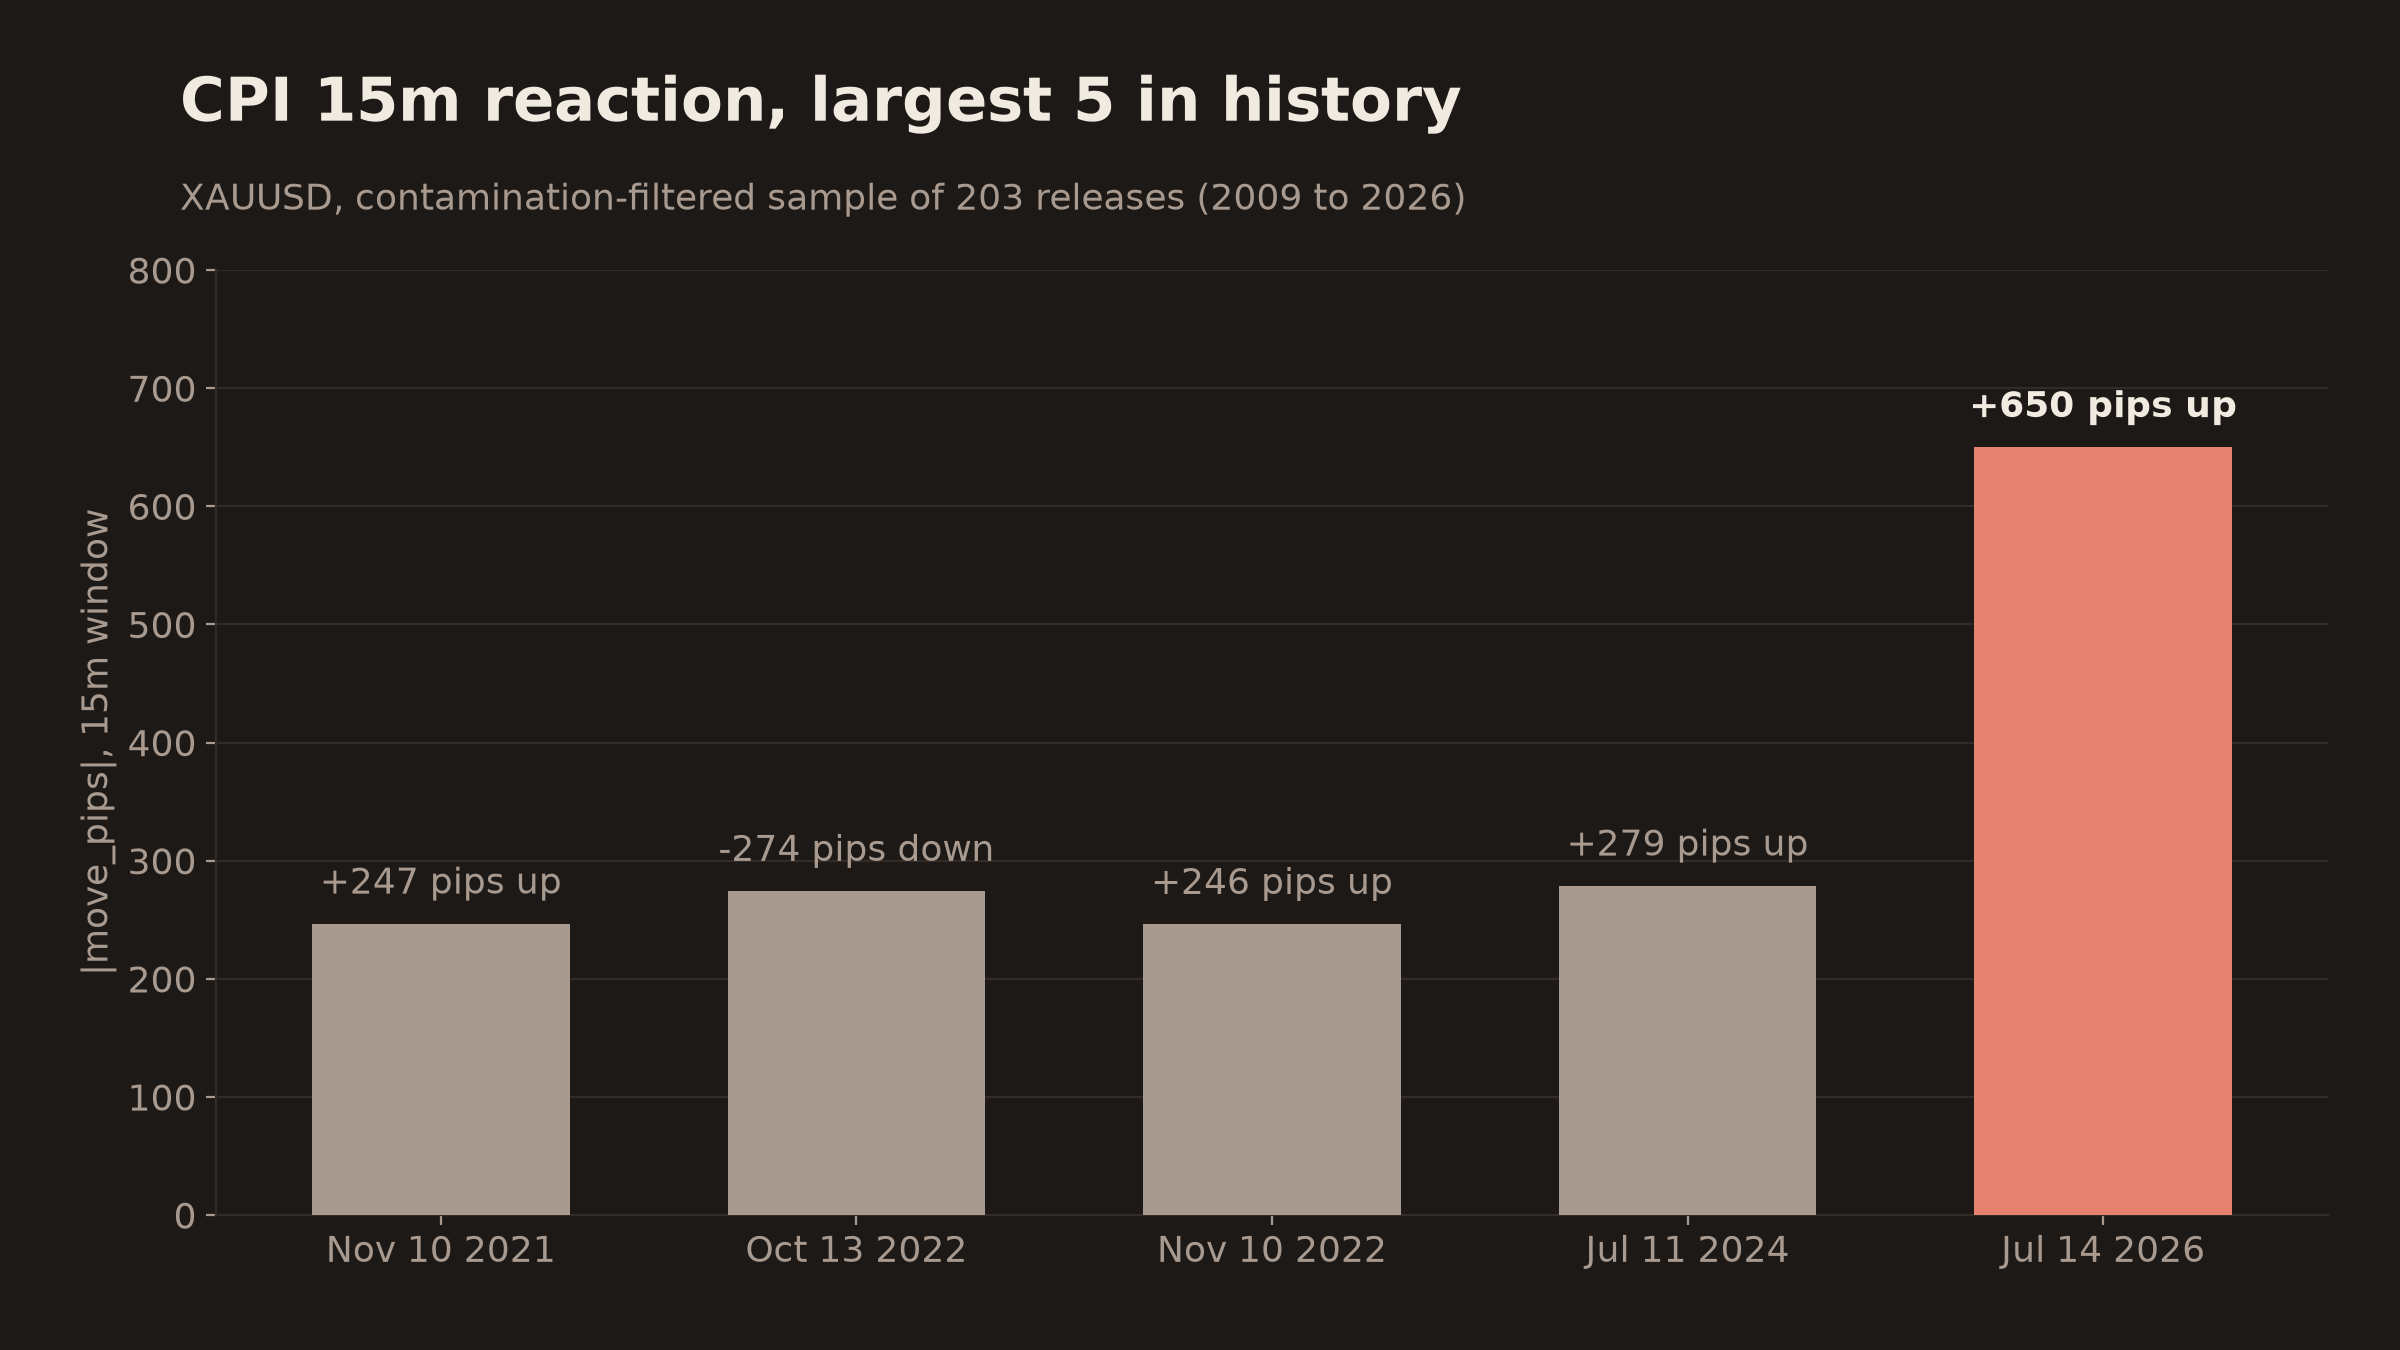
Then CPI closed the sequence on July 14 with the biggest ratio of the four. Inflation printed -0.4% against a -0.1% consensus, and gold moved 650.1 pips in fifteen minutes. The prior CPI record, 278.9 pips from July 2024, stood for two years across 203 releases. This print broke it by 2.33x.
Zooming out on Fed decisions specifically: 139 releases, mostly clustered inside 200 pips either side of zero. The June 17 print sits so far into the left tail it needs its own axis space.
What this doesn’t say
This doesn’t say every release is breaking records. ISM Manufacturing printed on July 1 and moved 10 pips. ISM Services printed on July 6 and moved 20. Both sat inside this same four-week window and broke nothing. NFP in March 2026 (+346) stayed under the old record too. The records are falling at the events that reprice policy: rates, jobs, inflation, growth. Not everywhere.
This doesn’t say XAUUSD is going higher. The moves broke records in both directions. The June 17 Fed reaction was -830 pips, a drop. The July 2 NFP was +677 pips, a rally. Regime shifts affect magnitude, not direction. The data can’t tell you which side of the next print will win. That’s your call.
This doesn’t say the next release will also break records.Four events is a small sample. Regime shifts don’t have to persist. What the data says is: the last four policy-repricing events were regime prints. What comes next is a separate question with a separate answer.
This doesn’t say the historical data is unreliable. The prior record for NFP (2025-08-01, 388.5 pips) was itself a regime print at the time. Every regime looks unusual until the next one arrives. What the tool does is show you what’s happened, honestly, without pretending the pattern will hold.
How to use this
News Impact Explorer shows, for any macro event and any pair, the full distribution of historical reactions. Median move. The ±1σ range (two out of three past reactions land within this band). Where the most recent release sits versus history.
If you trade around news, that’s the context you need to size your position. If a pair typically moves 40 pips around Fed and your stop is 30 pips wide, that stop is inside typical noise. If it’s 120 pips wide, the stop covers historical tail risk. The tool tells you what “typical” and “tail” mean for the specific pair and event you’re trading.
The tool does not tell you which way to trade. That stays with you.
Try it → Free forever. No signup. No email required.