NFP on USDJPY: 14 of 14 big-beat prints sent USDJPY up at 15 minutes, and the small-miss bucket falls harder than big-miss
196 non-contaminated NFP releases on USDJPY, 15-minute window. Medians walk −16.2 / −26.0 / +1.8 / +24.5 / +30.2 pips big_miss → big_beat. Pct-up walks 30 / 10.5 / 53 / 81 / 100 percent. Every single one of the 14 big-beat prints since 2010 sent USDJPY up at 15 minutes. The beat side widens through the day — big_beat median grows from +30 pips at 15m to +45 pips at 4h.
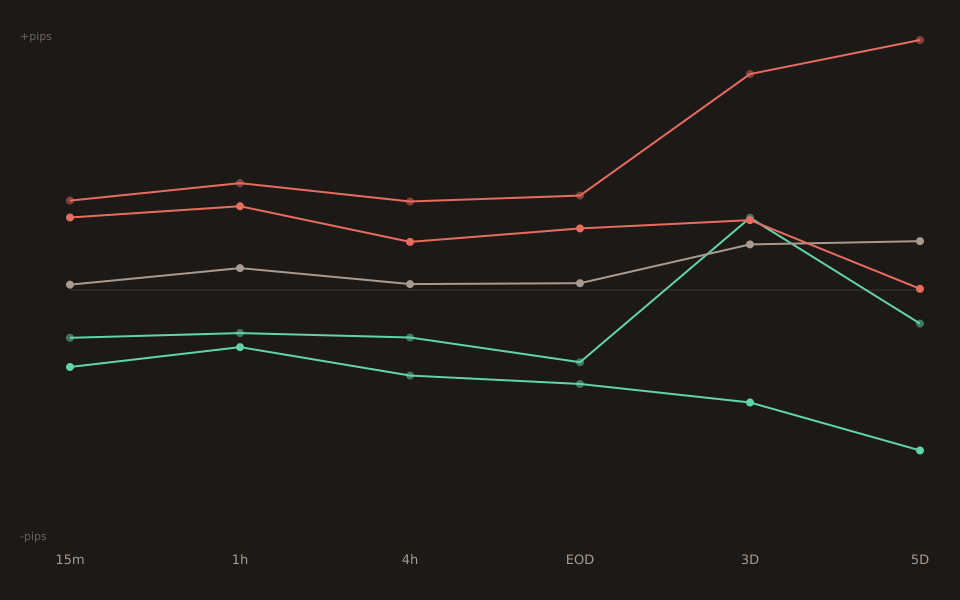
The 15-minute bucket table
| Bucket | n | 15m median | p25 | p75 | Pct up (15m) |
|---|---|---|---|---|---|
| big_miss | 10 | −16.15 | −27.75 | +9.05 | 30% |
| small_miss | 38 | −26.00 | −71.05 | −7.05 | 10.5% |
| in_line | 87 | +1.80 | −19.05 | +31.25 | 53% |
| small_beat | 47 | +24.50 | +6.65 | +69.60 | 81% |
| big_beat | 14 | +30.20 | +11.30 | +55.55 | 100% |
The big-beat unanimity, print by print
Every one of the 14 big-beat NFP prints since 2010 landed with USDJPY higher 15 minutes later. Chronological, from most-recent to earliest:
2026-04-03 actual +178k vs +65k consensus (z=+1.74): +2.5 pips. 2024-02-02 +353k vs +187k (z=+1.63): +109.5 pips. 2023-10-06 +336k vs +171k (z=+1.76): +46.1 pips. 2023-02-03 +517k vs +193k (z=+2.53): +149.3 pips. 2020-06-05 +2,509k vs −7,750k consensus (z=+21.75, COVID-reopening outlier): +30.9 pips. 2020-05-08−20,537k vs −22,000k (z=+7.71, “less bad than feared” on the COVID onset print): +29.5 pips. 2019-02-01 +304k vs +165k (z=+2.14): +1.4 pips. 2019-01-04 +312k vs +179k (z=+2.47): +28.1 pips. 2018-03-09 +313k vs +205k (z=+2.09): +12.2 pips. 2016-07-08 +287k vs +175k (z=+1.83): +70.3 pips. And 4 more earlier prints (2015, 2014, 2012, 2011) all positive at 15 minutes.
The 4 smallest positive prints (+1.4p, +2.5p, +12.2p, +28.1p) aren’t individually profitable after typical NFP spreads (2-3 pips) and slippage on a moving USDJPY, so the pattern isn’t a free trade. It IS a genuine directional bias, and it stacks up against a distribution-free 95% CI of 77% to 100% for the true up-rate (per the order- statistic method from Stats for Traders #3) — which is to say, on any 15-print refresh the up-rate is overwhelmingly likely to stay above 3-of-4.
Why small_miss falls harder than big_miss
The pct-up walk isn’t monotonic on the miss side: big_miss 30% up, small_miss 10.5% up — a small_miss print is MORE unanimously down than a big_miss print. This is a small-sample artifact, not a signal reversal. Big_miss has n=10 and includes three USDJPY-up-move prints: 2017-10-06 (actual −33k vs +82k consensus, USDJPY +40.7 pips at 15m — a US-government-shutdown-adjacent print where the market judged the miss to be noise-driven); 2013-04-05 (actual +88k vs +198k, +33.2p — a Fed-QE3-taper-anxiety month where the miss actually eased taper fears and helped USDJPY on Fed-doves grounds); and 2020-04-03(actual −701k vs −100k, +3.0p — the first “COVID has arrived in the data” print where the miss was so extreme that the immediate reaction was risk-parity flow rather than dollar-selling).
Three of ten (30%) up-rate on the tail bucket, n=38 (89% down) on the shoulder. Under IID sampling from the same underlying distribution the tail bucket’s 30% is well within noise of the shoulder’s 10.5% — the 95% CI for the tail bucket’s true up-rate runs roughly 7% to 65% (order-statistic CI on p̂=0.30 with n=10). Read the walk as “monotonic once you correct for tail sample size” rather than as a broken pattern.
How USDJPY and EURUSD mirror on this release
Both pairs are dollar-quoted, so an NFP surprise moves them in opposite directions on the dollar-direction channel. From the 2026-08-03 NFP moves gold in opposite direction of the dollar post, the NFP × EURUSD 15m walk is:
| Bucket | EURUSD med | EURUSD up% | USDJPY med | USDJPY up% |
|---|---|---|---|---|
| big_miss (n=10) | +11.65 | 70% | −16.15 | 30% |
| small_miss (n=38) | +12.50 | 84% | −26.00 | 10.5% |
| in_line (n=87) | −2.70 | 45% | +1.80 | 53% |
| small_beat (n=47) | −28.50 | 28% | +24.50 | 81% |
| big_beat (n=14) | −34.55 | 7% | +30.20 | 100% |
Same 196 releases, same buckets, opposite sign. EURUSD big_beat n=14 lands 13 of 14 prints DOWN (7% up-rate); USDJPY big_beat n=14 lands 14 of 14 prints UP (100% up-rate). The one EURUSD big_beat print that went up against expectation isn’t the same print as the (nonexistent) USDJPY big_beat down-print — the two pairs disagree on that one specific date for reasons buried in the intraday cross-flow. Everywhere else, they mirror.
What this doesn’t say
14 out of 14 does not mean 14 out of 14 forever. The 95% distribution-free CI on the true up-rate given 14 wins in 14 samples is 77% to 100%. That’s a range, not a guarantee — on any new 14-print refresh the up-rate stays overwhelmingly likely to be above 77% but 100% is not structurally guaranteed. The next big-beat print could well go down, and if it does the “14 of 14” headline becomes “14 of 15” without breaking the pattern.
Big_beat n=14 and big_miss n=10 are both tail buckets.The tool draws them faint (n<30) because the statistical confidence in the exact pip magnitudes is limited. Treat the +30.2p big_beat median as directionally accurate but wide (95% CI on the median runs roughly +2p to +70p). The direction of the bias is much better established than the magnitude.
Volatility clustering shortens the effective sample size. Today’s Stats for Traders #10 walks through the +0.26 lag-1 autocorrelation of |NFP × USDJPY move_pips|. Effective sample size for typical-range estimates is ~115, not 196 — which means any confidence interval on the p25/p75 columns should be ~30% wider than the naive-IID version. The signed direction of the moves is essentially unclustered (efficient-markets weak-form), so the CI penalty applies to VOLATILITY statements about this bucket table, not to the directional finding itself.
Open the tool → Free forever. No signup. No email required.