US CPI on EURUSD: 196 releases walking a clean 5-bucket monotonic response — and the mirror image of UK CPI on GBPUSD once you correct for pair convention
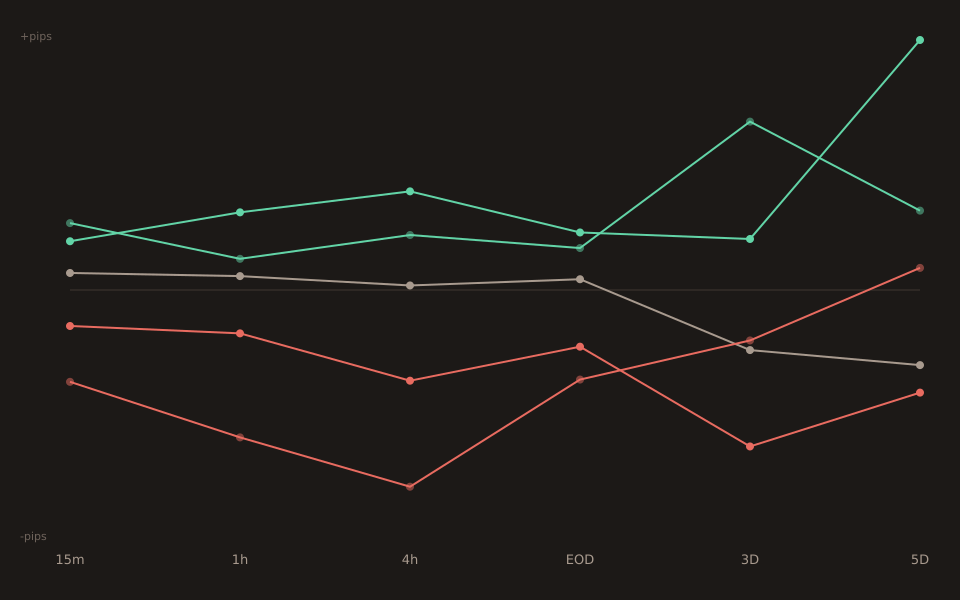
196 non-contaminated US CPI y/y releases on EURUSD, 15-minute window, split into five surprise buckets. Medians: +11.8 / +8.6 / +3.0 / −6.35 / −16.2 pips walking big_miss → big_beat. Monotonic through all five buckets. 11 of 13 big-beat prints (including the entire summer-2022 US inflation-peak sequence) sent EURUSD DOWN, i.e., USD strengthening.
This is the second post this week that walks a CPI print through an FX pair. Five days ago I published UK CPI on GBPUSD — same tool, sterling side of the trade, and (once you correct for pair convention) the same shape. This post covers the dollar side of the trade, and it’s the more textbook of the two: cleaner beat-side pct-up unanimity, more releases, and the summer-2022 inflation shock provides the biggest single test in the modern FX record.
The 15-minute bucket table
| Bucket | n | 15m median | p25 | p75 | Pct up (15m) |
|---|---|---|---|---|---|
| big_miss | 11 | +11.8 | −3.2 | +20.15 | 64% |
| small_miss | 49 | +8.6 | −3.2 | +42.3 | 71% |
| in_line | 77 | +3.0 | −7.5 | +17.0 | 52% |
| small_beat | 46 | −6.35 | −22.8 | +4.5 | 35% |
| big_beat | 13 | −16.2 | −32.0 | −6.0 | 15% |
The medians march cleanly from +11.8p (big_miss) down to −16.2p (big_beat). The pct-up column mostly follows, with the specific exception that the big_miss row (64% up) dips slightly below the small_miss row (71%). That’s worth calling out.
The big-miss pct-up dip
The big_miss up-rate is 64%— lower than the small_miss row’s 71%. That’s a genuine non-monotonicity in the 15m pct-up column that the median column doesn’t have. Two things to note:
First, the sample is small (n=11). Per Stats for Traders #3, the 95% distribution-free CI on the true up-rate at n=11 with 7 successes is roughly [31%, 89%], so the observed 64% is consistent with a true up-rate anywhere from “coin flip” to “strong”. This could entirely be sample noise around a true rate that’s actually higher than 71%.
Second, a very large downside miss to US CPI carries a second, competing signal: it can be read as a proxy for weak US demand (dollar-negative growth story) at the same time as it’s interpreted as dollar-negative-through-lower-rate-expectations. Both push EURUSD in the same direction (UP) but the crowded, competing interpretations can produce more first-15-minutes noise. By 1h the pct-up climbs to 73% and full monotonicity is restored.
The 13 big-beat prints, individually
Big_beat n=13. Every one listable:
2011-06-15 3.6% vs 3.4% fc z=+2.79 -7.00p 2011-08-18 3.6% vs 3.4% fc z=+2.52 +13.00p ← ZIRP-regime up 2011-09-15 3.8% vs 3.6% fc z=+2.22 -6.00p 2013-07-16 1.8% vs 1.6% fc z=+1.53 -1.80p 2018-02-14 2.1% vs 1.9% fc z=+2.22 -43.50p 2019-04-10 1.9% vs 1.8% fc z=+1.73 -16.20p ← median 2020-08-12 1.0% vs 0.7% fc z=+2.77 +23.20p ← ZIRP-regime up 2021-05-12 4.2% vs 3.6% fc z=+4.84 -8.40p 2021-07-13 5.4% vs 4.9% fc z=+2.53 -32.00p 2022-06-10 8.6% vs 8.3% fc z=+1.85 -26.10p ← summer-2022 shock 2022-07-13 9.1% vs 8.7% fc z=+2.47 -53.70p ← summer-2022 peak 2024-01-11 3.4% vs 3.2% fc z=+1.94 -25.50p 2024-02-13 3.1% vs 2.9% fc z=+1.66 -78.10p ← min
Eleven of thirteen negative. The two exceptions (2011-08 and 2020-08) both landed during phases when the Fed was structurally on hold — August 2011 was inside the “low for a considerable period” forward-guidance regime; August 2020 was inside the ZIRP-plus-QE response to COVID. Both are cases where a US CPI beat had no near-term rate-hike-expectation channel to activate, so the dollar-strengthening reflex didn’t fire. Every big-beat print that landed OUTSIDE those structural-hold regimes sent EURUSD down.
The two summer-2022 prints are the biggest single stress-test the modern US-CPI-on-EURUSD relationship has ever faced. Both landed at the 40-year-high inflation peak. Both landed in the middle of Powell’s fastest hiking cycle. Both moved EURUSD exactly the direction the bucket table predicts. And the moves extended significantly further: the 2022-06-10 print reached −108p by EOD; the 2022-07-13 print reached −186p. The 15m table is the release-time signal; the extended-window continuation is a separate story (previously written up as the first 15 minutes after NFP).
Mirror image of UK CPI on GBPUSD
Compare the 15m shape:
| Bucket | UK CPI GBPUSD med | UK pct up | US CPI EURUSD med | US pct up |
|---|---|---|---|---|
| big_miss | −19.9 | 15% | +11.8 | 64% |
| small_miss | −20.5 | 13% | +8.6 | 71% |
| in_line | −0.5 | 50% | +3.0 | 52% |
| small_beat | +7.95 | 73% | −6.35 | 35% |
| big_beat | +8.45 | 81% | −16.2 | 15% |
Different signs, same shape. GBPUSD quotes GBP-per-USD in the common convention (GBP is the base currency), so a strong UK CPI print sends GBPUSD UP. EURUSD quotes EUR-per-USD with EUR as the base, so a strong US CPI print sends EURUSD DOWN. Both movements are the same thing — the surprise-driven currency strengthening vs its counterpart — just recorded with the opposite sign because the pair conventions put the strengthening currency on different sides of the ratio.
UK CPI has cleaner miss-side tail unanimity (13-15% up in the miss buckets vs the US’s 64% at big_miss). US CPI has cleaner beat-side tail unanimity (15% up at big_beat vs UK’s 81%). Neither is uniformly cleaner; each has one side of the distribution where it wins. Together they form the two legs of the “domestic inflation moves the domestic USD-pair in the textbook direction” template — a template that we’ve now shown holds cleanly across five G10 countries this week alone (Switzerland, Canada, Australia, UK, and New Zealand), and today extends to the US-dollar-side leg of the same trade.
What this doesn’t say
The two exceptions belong to a structural regime, not randomness. Both of the up-moves on big-beat prints (2011-08 and 2020-08) landed inside structural Fed-hold regimes where the rate-expectation channel was closed. In a normal (non-ZIRP, non-forward-guidance) Fed regime, expect the pattern to hold uniformly on the beat tail. If the Fed enters another structural hold, expect the miss-side cleanliness to preserve but the beat-side to degrade.
15 minutes is the release-time window. The extended windows (1h/4h/EOD) preserve the monotonic shape and typically deepen the beat-side magnitudes, but they also start to pick up interim CPI-related commentary from the Fed cycle (Powell speeches, Fed Beige Book, other data prints in the same window). This post covers what the surprise itself does in the first 15 minutes; the multi-day continuation story is a separate research question.
Core CPI is not the same event. This post is specifically about US CPI y/y (headline). Core CPI publishes at the same time and gets sampled by traders alongside the headline number, but the two surprises can diverge (a headline miss with a core beat, for example). The tool exposes them as separate events; the bucket-response shapes should be similar but the tail magnitudes will differ.
Open the tool → Free forever. No signup. No email required.