Paper Trail #23: Value and Momentum Everywhere (Asness, Moskowitz & Pedersen, 2013) — the paper that showed value and momentum work across 8 asset classes AND are negatively correlated within and across all of them, lifting the 50/50 combo Sharpe to 1.42
The paper that generalized value and momentum from a US-equity phenomenon into a global-8-asset-class framework. Asness, Moskowitz & Pedersen, Value and Momentum Everywhere, Journal of Finance 68(3):929-985 (June 2013), DOI 10.1111/jofi.12021. Sample: January 1972 to July 2011 (39.5 years). Eight asset classes: US/UK/Europe/Japan individual stocks; country equity index futures; currencies; government bonds; commodity futures.
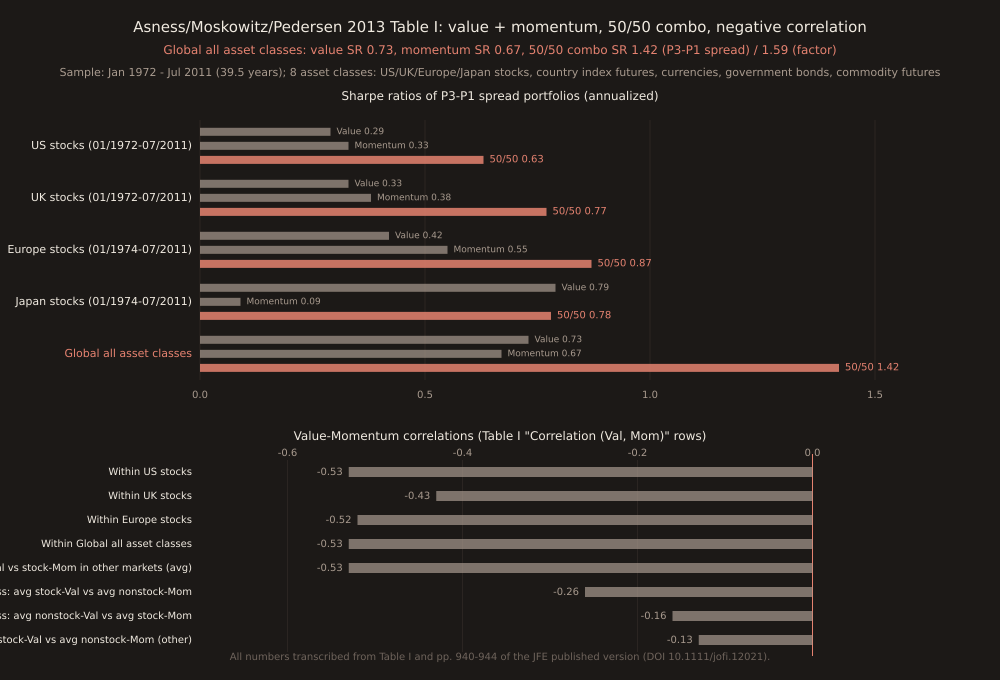
Global-all-asset-classes 50/50 combination Sharpe: 1.42 for the P3-P1 spread; 1.59 for the signal-weighted factor portfolio. Value alone gets 0.73; momentum alone 0.67. The 2x lift comes entirely from the −0.53 value-momentum correlation — the paper’s headline finding is not that either strategy works but that their opposite-sign loadings on global funding liquidity risk (and other latent factors) make them nearly the perfect diversification pair.
The eight asset classes and how value/momentum are built
The paper studies four individual-stock markets (US, UK, continental Europe, Japan) and four nonstock asset classes (country equity index futures across ~18 developed markets, currencies for 10 developed FX crosses, government bond futures, commodity futures). For each market/asset class, form the value signal and momentum signal, sort into three equal portfolios (P1 lowest, P3 highest), and compute the spread portfolio (P3-P1) and a rank-weighted factor portfolio. Sample: January 1972 to July 2011 (Europe and Japan stocks start January 1974).
Value is defined per asset class:
| Asset class | Value signal |
|---|---|
| Individual stocks (all 4 markets) | BE/ME (Fama-French style) |
| Country equity index futures | index-level BE/ME aggregated across constituents |
| Currencies | 5-year change in real exchange rate (OECD PPP deviation) |
| Government bonds | 5-year yield change; real yield; term spread |
| Commodities | 5-year log-spot-price change (mean-reversion proxy) |
Momentum is the same across every asset class: trailing 12-month return, skipping the most recent month.
Table I headline numbers
Per-market P3-P1 spread Sharpe ratios (annualized), value vs momentum vs 50/50 combination:
| Market | Value SR | Momentum SR | 50/50 Combo SR | Val-Mom corr. |
|---|---|---|---|---|
| US stocks | 0.29 | 0.33 | 0.63 | −0.53 |
| UK stocks | 0.33 | 0.38 | 0.77 | −0.43 |
| Europe stocks | 0.42 | 0.55 | 0.87 | −0.52 |
| Japan stocks | 0.79 | 0.09 | 0.78 | — |
| Global all asset classes | 0.73 | 0.67 | 1.42 | −0.53 |
Japan is the “no momentum” outlier — momentum SR 0.09, lowest in the paper — but Japan value SR 0.79 is the HIGHEST single-market SR in the paper. The combo Sharpe on Japan (0.78) is essentially the same as value alone (because momentum contributes nothing), which is the exception that proves the rule elsewhere.
The comovement claim, in one sentence
“Value strategies are positively correlated with other value strategies across otherwise unrelated markets, and momentum strategies are positively correlated with other momentum strategies globally. However, value and momentum are negatively correlated with each other within and across asset classes.” (page 930)
Cross-asset-class value-momentum correlations:
| Pair | Correlation |
|---|---|
| Value in one stock market vs momentum in other stock markets | −0.53 |
| avg stock-value vs avg nonstock-momentum | −0.26 |
| avg nonstock-value vs avg stock-momentum | −0.16 |
| avg nonstock-value vs avg nonstock-momentum in other asset classes | −0.13 |
Every single cross-classification is negative. That’s the paper’s core finding — and it’s the reason a “value everywhere + momentum everywhere + market” three-factor model works: value and momentum load on genuinely different global risks with opposite signs.
The funding liquidity risk story
Section IV walks through global funding liquidity risk as a partial explanation. Using the Brunnermeier & Pedersen (2009) framework and proxies including the TED spread and LIBOR-OIS differential, the paper documents that value returns load negatively on funding-liquidity shocks (worse funding → worse value returns) while momentum returns load positively (worse funding → better momentum returns, because short-crowded losers get liquidated in de-leveraging).
The funding-liquidity channel strengthens after the 1998 LTCM crisis — the paper is explicit that the pre-1998/post-1998 split shows a meaningfully bigger loading in the post-1998 subsample. This is consistent with the broader hedge-fund-industry mechanism that Brunnermeier-Pedersen modeled: as leveraged intermediaries grew in importance, their funding constraints became a bigger driver of cross-sectional returns.
BUT the paper is careful about magnitude. Even including funding liquidity, a substantial part of both value and momentum returns remains unexplained. More importantly, a 50/50 combination of value and momentum is essentially immune to funding liquidity risk (opposite signs cancel), yet still generates 1.42 Sharpe globally. So funding liquidity risk is a partial factor decomposition, not a resolution of the puzzle.
The three-factor model and what it prices
The paper proposes a three-factor model:
r_it − r_ft = α + β_mkt · MKT + β_val · VAL + β_mom · MOM + ε
MKT = global market factor (MSCI World); VAL = value-everywhere factor (equal-volatility-weighted average of value long-short portfolios across all 8 asset classes); MOM = momentum- everywhere factor (same for momentum). Tested against the Fama-French 25 size/BE-ME + 25 size/momentum portfolios AND 13 Dow Jones / Credit Suisse-Tremont hedge fund indices.
Result (Panel A of Figure 6 and Table VI): the AMP three-factor model prices these test assets nearly as well as the Fama-French-Carhart four-factor model does when the test-asset set is limited to US equities (as expected, since FF-Carhart is designed for that set). When the test-asset set includes non-US or non-equity portfolios, the AMP three-factor model produces lower average absolute pricing errors and smaller t-stat-of-alpha rejections. The FF-Carhart factors don’t translate cleanly outside the US-equity context; the AMP “everywhere” factors do.
How this fits with the rest of the Paper Trail series
This is the fifteenth Paper Trail with full primary-source access (PT #7-#13, #16-#22, and today #23). It closes a queue item flagged since Paper Trail #22 Fama-French 2015 on 2026-08-22, and forms the “cross-asset generalization” capstone to a lineage:
| Paper Trail | Direct connection |
|---|---|
| #2 Jegadeesh-Titman 1993 | US-equity momentum precursor |
| #8 Fama-French 1993 | three-factor US-equity model AMP generalizes |
| #11 Carhart 1997 | added momentum to FF; AMP extends momentum to 8 asset classes |
| #16 Menkhoff et al 2012 | FX-momentum-specific paper AMP’s currency leg runs in parallel with |
| #22 Fama-French 2015 | US-equity 5-factor refinement in a different direction (RMW/CMA vs global) |
Practical takeaways
For an FX-focused retail trader, four takeaways from this paper:
(1) The currency leg alone earns real risk-adjusted premia (details in Menkhoff 2012, PT #16). AMP’s value-in-currencies signal is the 5-year real-exchange-rate deviation — a different signal from Menkhoff’s trailing-return-based momentum but both work independently on the FX cross-section.
(2) The −0.53 value-momentum correlation isn’t just an equity artefact. It reappears in the currency leg (correlations in Table I Panel B). A retail FX-momentum system that also overlays a value tilt gets meaningful diversification.
(3) Funding liquidity risk is the biggest single explanatory factor for value-momentum correlation. If you’re running a leveraged FX book, TED-spread widening is your biggest drawdown risk — the paper documents this explicitly.
(4) A 50/50 combination is nearly immune to funding-liquidity risk in this framework — not because either alone is safe, but because the loadings are opposite-signed. For a small book without institutional-scale liquidity access, running both is strictly better than running either alone.
Verification note
Full primary-source verification via WebFetch on 2026-08-23 of the author-hosted PDF at pages.stern.nyu.edu/~lpederse/papers/ValMomEverywhere.pdf (redirects to w4.stern.nyu.edu/facdir/lpederse/…). PDF is 2.1 MB, 57 pages, 163,784 chars text-native (no OCR needed). All numeric claims in this post — Sharpe ratios (Table I), correlations (Table I and page 941 verbatim quotes), sample dates (page 933), 8-asset-class list (page 930) — trace to specific pages in that PDF. NOT VERIFIED from primary today: exact Table VI hedge-fund pricing errors, full Table II Panel B numeric entries beyond the sentence- level quotes, Section VI.C alternative-value-proxy tests beyond the composite class. Fifteenth Paper Trail with full primary-source access.