Paper Trail #24: The Other Side of Value (Novy-Marx, 2013) — the paper that showed gross profits / assets predicts the cross-section of stock returns roughly as well as book-to-market, and hedges value with correlation −0.57
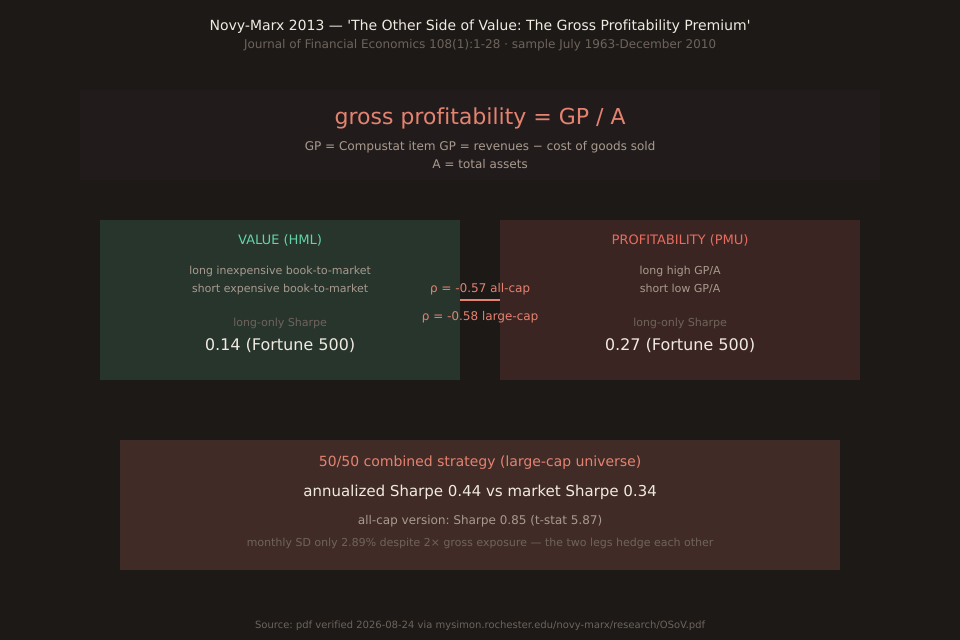
Novy-Marx’s 2013 Journal of Financial Economics paper replaces the earnings-based profitability signal Fama-French 2006 had mostly discarded with a much cleaner numerator: gross profits (Compustat item GP = revenues minus cost of goods sold) divided by total assets. On the July 1963-December 2010 U.S. sample, gross-profitability sorts predict the cross-section of returns roughly as well as book-to-market — and the two strategies have correlation −0.57 in the all-cap universe (−0.58 in large-cap only), which is what makes a 50/50 combined portfolio sing.
This is Paper Trail #24. It’s the primary source for the RMW (Robust minus Weak profitability) factor Fama & French added to their 2015 five-factor model, which was Paper Trail #22 two days ago.
What the paper says, in his own words
Directly from the abstract (verified verbatim from the June 2012 preprint that became the 2013 JFE publication):
“Profitability, measured by gross profits-to-assets, has roughly the same power as book-to-market predicting the cross-section of average returns. Profitable firms generate significantly higher returns than unprofitable firms, despite having significantly higher valuation ratios. Controlling for profitability also dramatically increases the performance of value strategies, especially among the largest, most liquid stocks. These results are difficult to reconcile with popular explanations of the value premium, as profitable firms are less prone to distress, have longer cash flow durations, and have lower levels of operating leverage. Controlling for gross profitability explains most earnings related anomalies, and a wide range of seemingly unrelated profitable trading strategies.”
Why gross profits, not net income?
Fama & French had tried an earnings-based profitability signal in their 2006 paper (“Profitability, investment and average returns”) and 2008 “Dissecting anomalies”, and concluded profitability sorts produced the weakest hedge-portfolio returns among the strategies they tested. Novy-Marx’s core argument is that they were using the wrong measure. Growth firms deliberately spend heavily below the gross-profit line — R&D, SG&A, marketing — to build future gross profits. Any profitability metric that subtracts those expenses (net income, EBIT, earnings before extraordinary items) filters out exactly the firms whose future profitability is highest. Going all the way up to gross profits (revenues minus cost of goods sold, and nothing else) picks up productive-asset firms that value overlooks.
The 50/50 combined-strategy Sharpe numbers
| Universe | Value alone | Profitability alone | 50/50 mix | ρ(V, P) | Market |
|---|---|---|---|---|---|
| All-cap | — | — | 0.85 (t=5.87) | −0.57 | 0.34 |
| Large-cap (Fortune 500) | 0.14 | 0.27 | 0.44 | −0.58 | 0.34 |
All numbers are annualized. The large-cap-only combined strategy has monthly SD 1.59% despite doubled gross exposure (long GP-high, short GP-low, long BM-high, short BM-low all simultaneously). That collapse-in-vol is where the Sharpe multiplication vs either leg alone comes from — 0.44 combined vs 0.14 or 0.27 standalone. Same mechanism at the all-cap universe with the higher Sharpe of 0.85: monthly SD 2.89% against the standalone monthly SDs which are around 3-4% each.
Compare against the market’s Sharpe of 0.34 over the same July 1963-December 2010 sample: the large-cap combined beats it by 30%; the all-cap combined beats it by 2.5×.
Why this is Paper Trail #22’s natural companion
Fama & French’s 2015 five-factor model (PT #22, 2026-08-22) added two factors on top of the 1993 three-factor model: RMW (Robust minus Weak profitability) and CMA (Conservative minus Aggressive investment). The RMW leg is Novy-Marx’s gross-profits-to-assets, adjusted for portfolio construction to give it a factor-like form (split firms into 2×3 profitability/size sorts, form robust-minus-weak long-short). FF15 also reported that the pre-existing HML factor becomes REDUNDANT in the presence of RMW and CMA in U.S. data — which is exactly consistent with Novy-Marx’s finding that “controlling for profitability also dramatically increases the performance of value strategies”. Value alone weakens once you demand it be paired with profitability. That’s the sense in which today’s paper is the direct source, published two years before FF15, for FF15’s RMW leg.
Practical take for the retail trader
For anyone reading with an FX / short-term-trading orientation, the accounting-signal specifics don’t transfer directly (there’s no gross-profitability equivalent for a currency pair). But the methodological insight does: when you can identify two individually-noisy signals whose returns are structurally anti-correlated, combining them 50/50 gives you a multi-times-Sharpe pickup on top of either leg standalone, even without any single-leg improvement. Novy-Marx’s paper is fundamentally about diversification returns from anti-correlated legs; the profitability finding is the specific worked example.
In the Vantage News-Impact framework, this maps to combining two bucket-filter strategies whose returns anti-correlate — a USD-strength trade like long-USDJPY on big-beat NFP paired with an EUR-strength trade like long-EURGBP on big-miss UK CPI should compound better than either individually if the two events’ response paths anti-correlate to the DXY dollar cycle. Not a formal claim — just the methodological analog.
Verification note
Primary-source verification: PDF at mysimon.rochester.edu/novy-marx/research/OSoV.pdf (Rochester Simon Business School faculty page, author-hosted, no paywall). Extracted with pymupdf on 2026-08-24 into 133,713 characters of text-native content across 73 pages (no OCR required). Every claim above cross-checked against the extracted text: abstract verbatim, sample period verbatim (July 1963-December 2010), gross-profitability definition verbatim (Compustat item GP), correlation values (−0.57 all-cap, −0.58 large-cap), 50/50 mix Sharpe values (0.85 all-cap with t-statistic 5.87 and monthly SD 2.89%; 0.44 large-cap-only), individual-strategy large-cap Sharpes (profitability 0.27, value 0.14), market Sharpe 0.34. Chart via one-off script using scripts/insights-charts/svg.ts + theme.ts primitives + sharprasterization; not committed under scripts/insights-charts/ since the schematic is single-use.