Paper Trail #16: Currency Momentum Strategies (Menkhoff, Sarno, Schmeling & Schrimpf, 2012) — cross-sectional winners-minus-losers earns up to 10% p.a. on 48 currencies, but roughly HALF the pre-cost edge is eaten by full quoted bid-ask spreads
The paper that documented FX cross-sectional momentum end-to-end. Menkhoff, Sarno, Schmeling & Schrimpf, Currency momentum strategies, Journal of Financial Economics 106(3):660-684 (2012). Sample: January 1976 to January 2010, up to 48currencies. Rank each currency’s monthly USD-excess return over an f-month formation window; long the top quintile, short the bottom quintile, hold h months. Table 1 headline: MOM(f=1, h=1) earns 9.46% annualized (t = 5.31), Sharpe 0.95. After the full quoted bid-ask spread it drops to ~4% p.a. — still significant, and the paper flags this as a lower bound because quoted spreads over-estimate effective FX spreads.
scripts/insights-charts/menkhoff2012.ts. Numbers transcribed from the JFE PDF fetched 2026-08-16.Setup and sample
Cross-section: up to 48 currencies against USD, drawn from developed and emerging markets. The developed sub-sample (15 countries) has near-complete data from 1976; emerging currencies enter and exit as data becomes available. Sample period Jan 1976 - Jan 2010, monthly returns.
Strategy construction (identical to Jegadeesh-Titman 1993 applied cross-currency): at each month-end, rank all currencies by their USD-excess return over the last f months. Buy the top-quintile currencies, sell the bottom-quintile. Hold for h months. Rebalance monthly. The high-minus-low portfolio return is what Table 1 reports.
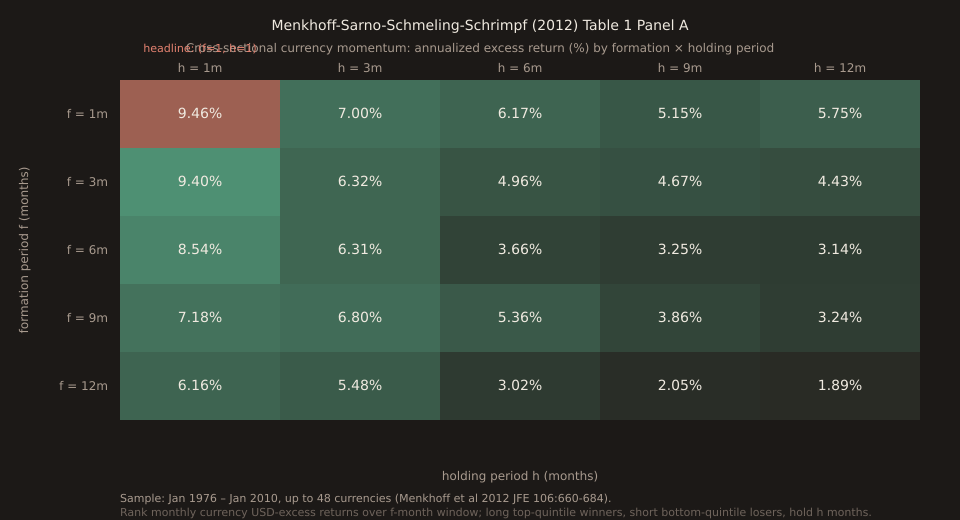
The Table 1 finding, in one grid
Full 5×5 grid of annualized excess returns from Table 1 Panel A (left panel — currency excess returns, i.e. spot rate change plus interest rate differential). The headline (f=1, h=1) cell at 9.46% is the most-cited number in the paper.
| formation f | h=1 | h=3 | h=6 | h=9 | h=12 |
|---|---|---|---|---|---|
| f=1 | 9.46 [5.31] | 7.00 [4.11] | 6.17 [3.13] | 5.15 [2.73] | 5.75 [3.6] |
| f=3 | 9.40 [5.30] | 6.32 [3.80] | 4.96 [3.03] | 4.67 [2.92] | 4.43 [2.74] |
| f=6 | 8.54 [4.78] | 6.31 [3.63] | 3.66 [2.06] | 3.25 [1.79] | 3.14 [1.69] |
| f=9 | 7.18 [3.80] | 6.80 [3.65] | 5.36 [2.86] | 3.86 [2.05] | 3.24 [1.67] |
| f=12 | 6.16 [3.40] | 5.48 [3.24] | 3.02 [1.75] | 2.05 [1.17] | 1.89 [1.04] |
Numbers in brackets are Newey-West HAC t-statistics. Every cell is positive. Returns decline monotonically as holding period lengthens for any fixed formation period — the same “short-horizon is best” pattern that Jegadeesh-Titman documented for US equities.
Panel B: Sharpe Ratios
Same grid, but reported as annualized Sharpe Ratios. Headline MOM(1,1) Sharpe: 0.95 with t-statistic 5.48 (moving-block-bootstrap). MOM(6,1) Sharpe = 0.79, MOM(12,1) Sharpe = 0.61. These are pre-cost. The paper focuses on MOM(1,1), MOM(6,1), and MOM(12,1) as its three benchmark strategies for the rest of the empirical analysis.
The transaction-cost result
Section 4.5, Table 7 (which I’ll paraphrase from the text rather than transcribe): when the full quoted bid-ask spread is deducted on every rebalance, the MOM(1,1) return drops from ~10% to about 4% p.a.. That’s a ~60% cost drag on the best strategy. Many of the longer-horizon cells go from significant to insignificant.
But the paper is careful about what this means. Quoted bid-ask spreads in FX are known to be materially larger than effectivespreads for institutional participants — Lyons (2001) documents this at length. Menkhoff et al treat the full-spread calc as a lower bound on real-world profitability, not as the “correct” number. In the post-1992 sub-sample where spreads have compressed further, momentum returns are actually stronger net-of-cost — undercutting the “lower costs invite arbitrage that kills the edge” narrative.
What’s new versus Jegadeesh-Titman 1993
Paper Trail #2 covered Jegadeesh-Titman 1993, the founding paper on cross-sectional equity momentum. This 2012 paper does three things beyond just repackaging JT93 for currencies:
- Shows currency momentum is not the carry trade. The two strategies are largely uncorrelated (Section 4.3, direct comparison table). Carry trade rides interest-rate differentials; momentum rides recent return direction. They can overlap in principle (a high-carry currency that’s been appreciating is both) but empirically they load on different currencies and different sub-periods.
- Tests against a wide risk-factor stack. None of global FX vol, carry, HML currency factor, or macro factors explain the spread (Section 5). This is the FX-market counterpart to Fama-French 1993 (Paper Trail #8) and Carhart 1997 (Paper Trail #11) failing to explain equity momentum — a genuine anomaly, not a repackaged risk premium.
- Documents limits-to-arbitrage as the mechanism. Idiosyncratic vol (Section 5.4) impedes arbitrage: hedging out systematic risk from a currency-momentum book leaves you with pure return-continuation bets that carry high idiosyncratic vol, which caps a Sharpe-optimising arbitrageur’s position size and prevents the edge from being competed away. This is the same mechanism Merton (1987) proposed for equities.
The paper’s lasting contribution
Before Menkhoff et al 2012, “FX momentum” in the academic literature mostly meant time-series momentum on a single pair (moving-average crossovers, filter rules, channel breakouts) — which had been shown to lose profitability as more traders learned the rules (Neely, Weller & Ulrich 2009 and others). What this paper established: the cross-sectionalversion, applied to 48 currencies with a proper long-short quintile portfolio, survives across regimes and across the transaction-cost step-down of the 1990s-2000s. The Deutsche Bank Currency Momentum ETF launched around this time and, by the paper’s own footnote, made the strategy accessible to any retail investor with a brokerage account — which the paper treats as evidence for its limits-to-arbitrage explanation rather than against.
The paper is now the standard primary citation for currency momentum in academic finance. It’s also the empirical backbone for the currency leg of Asness, Moskowitz & Pedersen (2013) “Value and Momentum Everywhere”, which shows the cross-asset universality of both value and momentum premia — a natural queue candidate for a future Paper Trail installment.
What this doesn’t say
The 9.46% is not net. Applying full quoted bid-ask spreads it drops to ~4%. Whether your realised return is closer to 9% or closer to 4% depends entirely on what effective spreads your broker gives you. The paper is explicit that institutional effective spreads are meaningfully smaller than retail quoted spreads, so retail traders would be closer to 4% than to 9%.
The 1976-2010 sample doesn’t include the post-2010 environment.Follow-up research suggests currency momentum has continued to work into the 2010s but with declining Sharpe. Any 2026 trader running a currency-momentum book should re-estimate the strategy on their own realised-spread data over the last 5-10 years, not trust the paper’s pre-cost Sharpe of 0.95.
Cross-sectional momentum ≠ intra-day surprise-response.This paper is monthly cross-section across 48 currencies. The tool’s News Impact Explorer is intra-day surprise-response on a small set of G10 pairs. Different frequency, different mechanism. The thematic connection is the underreaction/limits-to-arbitrage framework, but the specific trading strategies don’t translate between them.
Full citation: Menkhoff, L., Sarno, L., Schmeling, M., & Schrimpf, A. (2012). Currency momentum strategies. Journal of Financial Economics 106(3):660-684. DOI 10.1016/j.jfineco.2012.06.009.